

Bitcoin (BTC) Price Prediction 2026-2050
Get Bitcoin price predictions for 2027, 2028, 2029, 2030, and beyond. Predict how much BTC could grow over the next five years or longer, with instant forecasts based on market trends and sentiment.
*Disclaimer: All price predictions are based on user input.
| Current Price | BTC in 2027 | BTC in 2028 | BTC in 2029 | BTC in 2030 |
|---|---|---|---|---|
| $63,989.99 | $67,189.4895 | $70,548.963975 | $74,076.41217375001 | $77,780.23278243751 |
Short Term Bitcoin Price Prediction For Today, Tomorrow, This Week, and 30 Days
Based on the current forecast inputs, the model projects a short-term price path over the next 30 days. The table below outlines the expected price levels for today, tomorrow, this week, and the 30-day horizon.
- July 30, 2026(Today)$ 63,989.990.00%
- July 31, 2026(Tomorrow)$ 63,998.75570.01%
- August 6, 2026(This Week)$ 64,051.35020.10%
- August 29, 2026(30 Days)$ 64,252.96250.41%
Bitcoin (BTC) Price Prediction Today
The predicted price for BTC on July 30, 2026(Today) is $63,989.99. This estimate is based on the current forecast inputs and provides a quick snapshot of where prices could trade over the next 24 hours.Learn more about BTC live price today.
Bitcoin (BTC) Price Prediction Tomorrow
For July 31, 2026(Tomorrow), the projected price for BTC is $63,998.7557, using an annual growth input of 5%. This view helps frame the next-day baseline under the same assumption set.
Bitcoin (BTC) Price Prediction This Week
By August 6, 2026(This Week), the projected price for BTC is $64,051.3502, based on the same annual growth input of 5%. This weekly checkpoint summarizes the expected direction over the coming days under a steady-growth scenario.
Bitcoin (BTC) Price Prediction 30 Days
Looking 30 days ahead to August 29, 2026(30 Days), the projected price for BTC is $64,252.9625. This estimate applies the same annual growth input of 5% to approximate where price could stand after one month.
Long-term Bitcoin Price Prediction: 2026, 2027, 2028, 2029, 2030, 2040, 2050
Based on long-term price forecast modules, Bitcoin could be $63,989.99 in 2026, $67,189.4895 in 2027, $70,558.3950 in 2028, $74,086.3147 in 2029, $77,790.6304 in 2030, $126,763.5639 in 2040, and $206,539.6977 in 2050.
Scroll down to view the full table of yearly price targets and projected ROI for Bitcoin.
- Jul 2026$ 57,590.991$ 63,989.99$ 70,388.98910.00%
- Aug 2026$ 57,830.1329$ 64,255.7032$ 70,681.273610.46%
- Sep 2026$ 58,062.5061$ 64,513.8956$ 70,965.285210.90%
- Oct 2026$ 58,303.6060$ 64,781.7844$ 71,259.962811.36%
- Nov 2026$ 58,537.8816$ 65,042.0907$ 71,546.299811.81%
- Dec 2026$ 58,780.9555$ 65,312.1727$ 71,843.390012.27%
Bitcoin (BTC) Price Analysis Based on Key Market Indicators
Technical analysis looks at price action and common indicators to understand trend and momentum. Below is an automated snapshot of Bitcoin across multiple timeframes, summarizing the current technical bias and what the chart is signaling next. This is a technical read—not a guaranteed forecast, so please do your own research and manage risk appropriately.
| Moving Averages: | Strong Sell | Sell 12 | Neutral 0 | Buy 2 |
| Technical Indicators: | Buy | Sell 3 | Neutral 2 | Buy 7 |
Key Drivers of Bitcoin Price Forecasts
Factors that may affect Bitcoin price predictions often track macro risk conditions because top-volume assets tend to anchor the broader crypto market. Bitcoin can react quickly to US equity risk appetite, interest-rate expectations, and global dollar liquidity. Longer-term forecasts also reflect network fundamentals such as on-chain activity, fee demand, major protocol upgrades, long-term holder behavior, and structural supply dynamics that influence adoption and circulating supply.
How much will your Bitcoin be worth in 1 years?
Use our tool to predict the future value of your Bitcoin (BTC) investment over the next 1 years. By entering your investment amount and expected annual growth rate, you can easily calculate your projected return on investment.
How Bitcoin (BTC) Price Projection Works
This tool shows a what-if price path for Bitcoin based on the growth rate you enter. It updates instantly using the latest price.
Input your expected short-term yield change of 5% (positive or negative). This allows you to simulate market volatility and quickly assess profit or loss for Bitcoin under different conditions.
For long-term planning, the system applies a default 5% annualized growth rate. This helps you evaluate the potential of holding Bitcoin under steady market growth scenarios.
Simply enter your investment amount and expected annualized growth rate. The calculator instantly quantifies your investment goals, projecting the future value of your BTC holdings.
Based on your inputs, instantly view the projected total asset value and Return on Investment (ROI) across different timeframes, providing data-backed support for your holding strategy.
Important: This is a scenario calculator, not a guaranteed prediction, and it shouldn’t be treated as financial advice.
Frequently Asked Questions (FAQ):
Bitcoin Hot News
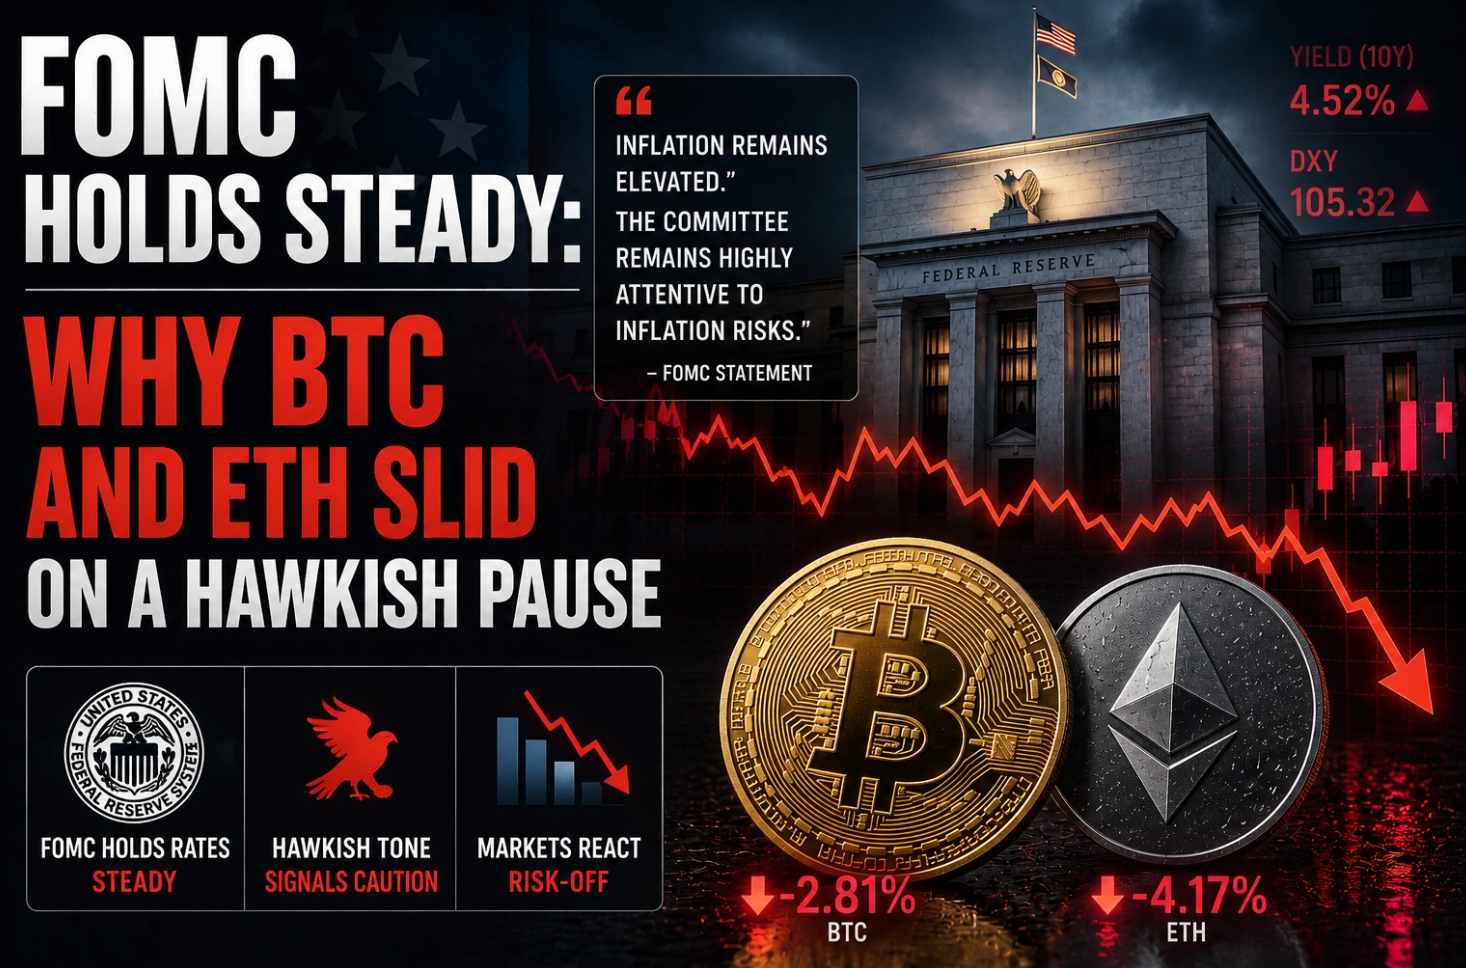
FOMC Holds Steady: Why BTC and ETH Slid on a Hawkish Pause

MEXC On-chain Daily Report: Robinhood Chain daily DEX volume surpassed $560 million

Strategy Starts STRC Buyback: Is This a Par-Defense Trade or a Bitcoin Treasury Stress Signal?
Explore More about Bitcoin
Trade Bitcoin (BTC) Markets on MEXC
Explore spot and futures markets, view live Bitcoin price, volume, and trade directly.
Disclaimer
The content published on our crypto price predictions pages is based on information and feedback provided to us by MEXC users and/or other third-party sources. It is presented to you on an "as is" basis for informational and illustrative purposes only, without any representation or warranty of any kind. It's important to note that the presented price predictions may not be accurate and should not be treated as such. Future prices may significantly differ from the presented predictions, and they should not be relied upon for investment decisions.
Furthermore, this content should not be construed as financial advice, nor is it intended to recommend the purchase of any specific product or service. MEXC shall not be liable to you in any way for any losses that you may incur as a result of referencing, using, and/or relying on any content published on our crypto price predictions pages. It's essential to be aware that digital asset prices are subject to high market risk and price volatility. The value of your investment may both decrease and increase, and there's no guarantee of getting back the amount initially invested. Ultimately, you are solely responsible for your investment decisions, and MEXC is not liable for any losses you may incur. Please keep in mind that past performance is not a reliable predictor of future performance. You should only invest in products you are familiar with and understand the associated risks. Carefully consider your investment experience, financial situation, investment objectives, and risk tolerance, and consult an independent financial adviser before making any investment decisions.
What is your sentiment on Bitcoin?
 Very Bullish
 Bullish
 Neutral
 Bearish
 Very Bearish
Top Trending Tokens
Find price predictions for today's hottest trending tokens.
Top Trading Volume Tokens
Explore market forecasts for tokens with the highest trading volumes.
Newly Added Tokens
Be first to discover price predictions for newly listed tokens.
Top Gainers
Explore the price prediction of the 24-hour top gainers.
Top Recommended Emerging Tokens
Discover the latest emerging tokens with strong potential.