Bitcoin may no longer be moving in lockstep with the S&P 500 over a short time frame, but that does not mean it has escaped the broader risk-off regime. In AxelBitcoin may no longer be moving in lockstep with the S&P 500 over a short time frame, but that does not mean it has escaped the broader risk-off regime. In Axel

Bitcoin Isn’t Decoupling From Stocks Yet, And This Chart Shows Why

2026/04/01 04:00
Okuma süresi: 3 dk
Bu içerikle ilgili geri bildirim veya endişeleriniz için lütfen crypto.news@mexc.com üzerinden bizimle iletişime geçin.

Bitcoin may no longer be moving in lockstep with the S&P 500 over a short time frame, but that does not mean it has escaped the broader risk-off regime. In Axel Adler Jr.’s latest morning brief, the more important signal is not the breakdown in short-term correlation, but Bitcoin’s continued relative weakness against US equities.

Bitcoin Weakens Against The S&P 500

Adler’s argument rests on two charts that, taken together, push back on the increasingly familiar claim that a lower BTC-equity correlation automatically points to decoupling. The first is the 13-week BTC-S&P correlation, which has recently turned negative and stayed below zero. On the surface, that could look constructive for Bitcoin. But Adler argues that the reading is easy to misinterpret.

BTC-S&P Correlation (13-week)

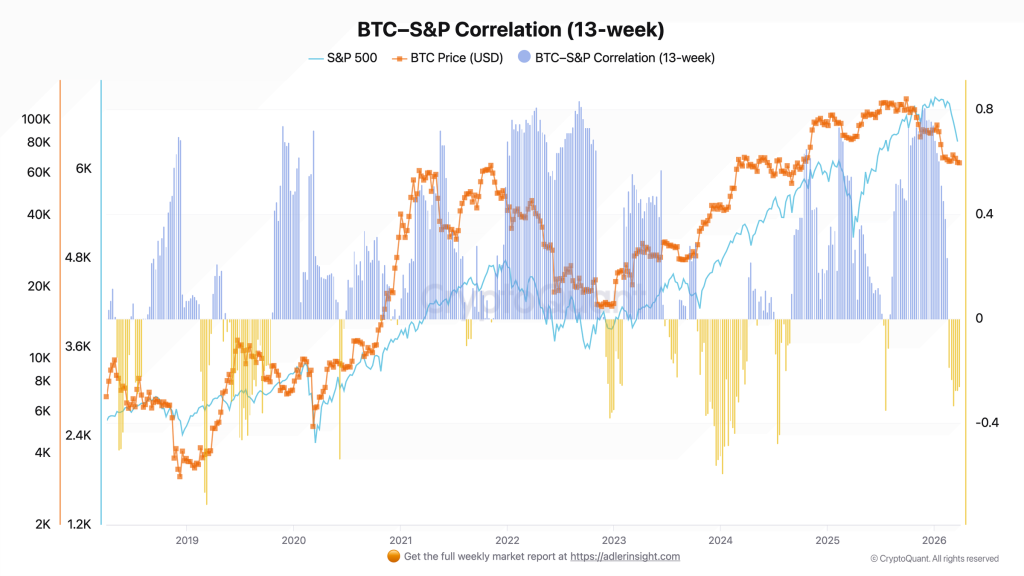
“The 13-week correlation measures how closely the weekly returns of BTC and the S&P 500 have moved together over a short window,” he wrote. “Over recent weeks, the short-term correlation has turned negative and has been holding below zero. At first glance this might look like a loosening of the link between BTC and equities – but in practice it more likely reflects the choppy nature of recent weeks, where isolated Bitcoin bounces have alternated with continued weakness in the index.”

That distinction is central to the note. A falling or negative correlation only says that the two assets are no longer moving neatly together over that window. It does not say Bitcoin is strong. It does not say capital is treating BTC as a defensive asset. And it does not confirm that the market has begun to price Bitcoin independently of the same macro pressures hitting equities.

For that, Adler points to the second chart: the BTC/S&P price ratio. This is where the case for decoupling breaks down. The ratio, which tracks Bitcoin’s performance relative to the S&P 500, has declined since the start of the year and remains under pressure. In practical terms, that means Bitcoin has been underperforming stocks even during periods when the short-term correlation has weakened.

BTC / S&P Price Ratio

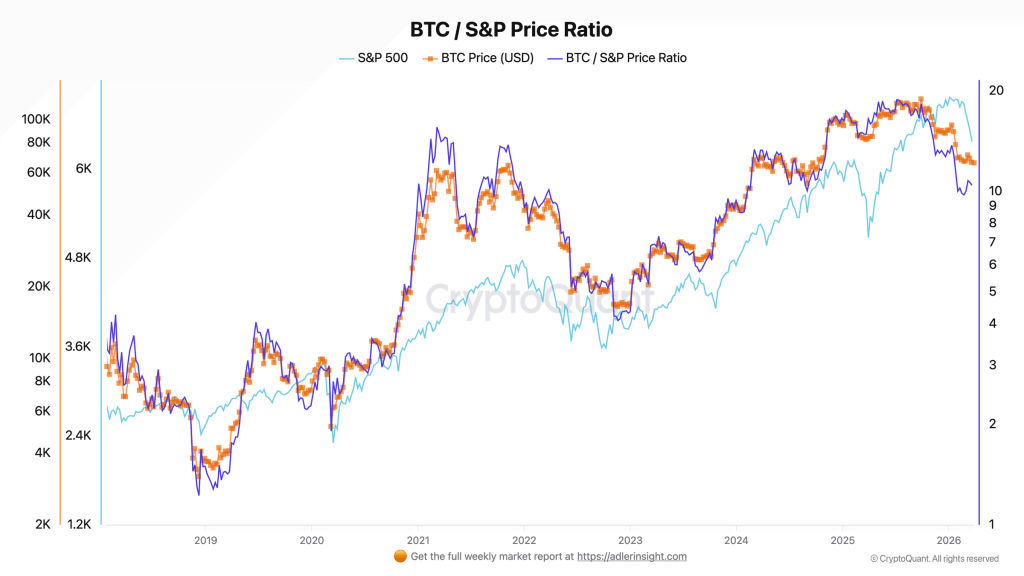
“What matters to the market here is not the fact of negative correlation per se, but whether it is accompanied by sustained BTC outperformance over the S&P,” Adler wrote. “That confirmation is not there yet, so it is too early to talk about Bitcoin achieving genuine independence from the risk-off regime.”

That framing matters because it shifts the focus away from a single statistical measure and back toward market behavior. If Bitcoin were truly decoupling, the relative-strength picture would likely be improving. Instead, Adler argues, the market is still assigning Bitcoin the role of a higher-beta risk asset, one with “higher risk and a larger drawdown amplitude” than the index.

He makes the point even more explicitly in the note’s conclusion. “The market is currently sending an uncomfortable but fairly honest signal,” Adler wrote. “The S&P 500 continues to decline, and BTC is not merely staying vulnerable to external risk-off pressure – it continues to underperform the index in relative terms. The prevailing regime remains risk-off.”

In that framework, the more useful trigger to watch is not whether correlation stays negative for another week, but whether the BTC/S&P ratio can reverse and hold higher. Adler says only “a new stable regime” of relative outperformance would support a real decoupling thesis. Until then, the market message remains straightforward: the relationship between Bitcoin and equities may have become less linear, but not less risk-sensitive.

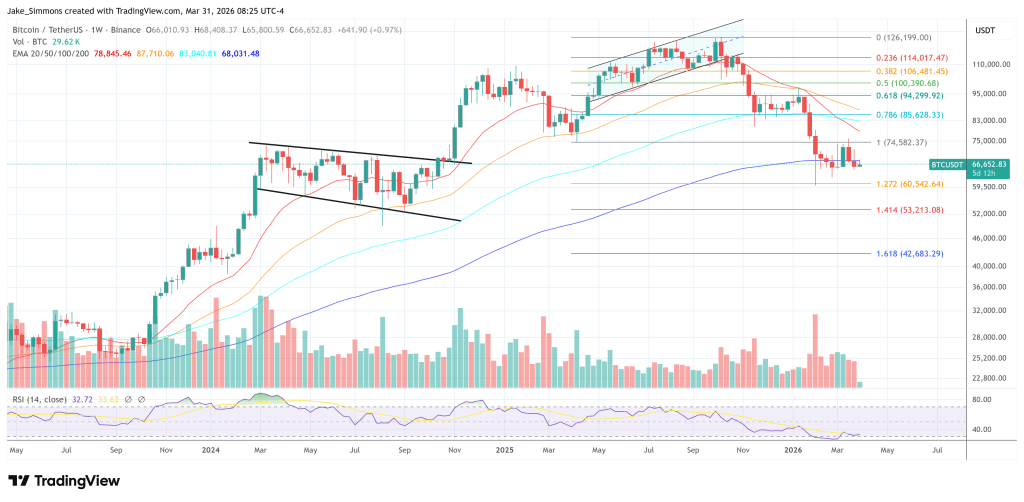
At press time, BTC traded at $66,652.

Bitcoin price chart
Piyasa Fırsatı
Bitcoin Logosu
Bitcoin Fiyatı(BTC)
$66,949.84
$66,949.84$66,949.84
+0.15%
USD
Bitcoin (BTC) Canlı Fiyat Grafiği
Sorumluluk Reddi: Bu sitede yeniden yayınlanan makaleler, halka açık platformlardan alınmıştır ve yalnızca bilgilendirme amaçlıdır. MEXC'nin görüşlerini yansıtmayabilir. Tüm hakları telif sahiplerine aittir. Herhangi bir içeriğin üçüncü taraf haklarını ihlal ettiğini düşünüyorsanız, kaldırılması için lütfen crypto.news@mexc.com ile iletişime geçin. MEXC, içeriğin doğruluğu, eksiksizliği veya güncelliği konusunda hiçbir garanti vermez ve sağlanan bilgilere dayalı olarak alınan herhangi bir eylemden sorumlu değildir. İçerik, finansal, yasal veya diğer profesyonel tavsiye niteliğinde değildir ve MEXC tarafından bir tavsiye veya onay olarak değerlendirilmemelidir.

Ayrıca Şunları da Beğenebilirsiniz

Today’s Biggest Crypto Movers: Dogecoin Leads the Pack

Today’s Biggest Crypto Movers: Dogecoin Leads the Pack

Today's Biggest Crypto Movers: Dogecoin Leads the Pack 🚀 Crypto Markets Heat Up Today Major cryptocurrencies are showing strong gains. Let's dive into today's top
Paylaş
Blockchainmagazine2026/04/03 13:00
RWA Boom Accelerates As Tokenized Assets Hit New Highs In Early 2026

RWA Boom Accelerates As Tokenized Assets Hit New Highs In Early 2026

RWA distributed value rose from about $21B to $27.5B in Q1 2026, a gain of roughly 30%. Tokenized US Treasuries reached about $10B, creating an on-chain yield base
Paylaş
LiveBitcoinNews2026/04/03 13:00
Cryptos Signal Divergence Ahead of Fed Rate Decision

Cryptos Signal Divergence Ahead of Fed Rate Decision

The post Cryptos Signal Divergence Ahead of Fed Rate Decision appeared on BitcoinEthereumNews.com. Crypto assets send conflicting signals ahead of the Federal Reserve’s September rate decision. On-chain data reveals a clear decrease in Bitcoin and Ethereum flowing into centralized exchanges, but a sharp increase in altcoin inflows. The findings come from a Tuesday report by CryptoQuant, an on-chain data platform. The firm’s data shows a stark divergence in coin volume, which has been observed in movements onto centralized exchanges over the past few weeks. Bitcoin and Ethereum Inflows Drop to Multi-Month Lows Sponsored Sponsored Bitcoin has seen a dramatic drop in exchange inflows, with the 7-day moving average plummeting to 25,000 BTC, its lowest level in over a year. The average deposit per transaction has fallen to 0.57 BTC as of September. This suggests that smaller retail investors, rather than large-scale whales, are responsible for the recent cash-outs. Ethereum is showing a similar trend, with its daily exchange inflows decreasing to a two-month low. CryptoQuant reported that the 7-day moving average for ETH deposits on exchanges is around 783,000 ETH, the lowest in two months. Other Altcoins See Renewed Selling Pressure In contrast, other altcoin deposit activity on exchanges has surged. The number of altcoin deposit transactions on centralized exchanges was quite steady in May and June of this year, maintaining a 7-day moving average of about 20,000 to 30,000. Recently, however, that figure has jumped to 55,000 transactions. Altcoins: Exchange Inflow Transaction Count. Source: CryptoQuant CryptoQuant projects that altcoins, given their increased inflow activity, could face relatively higher selling pressure compared to BTC and ETH. Meanwhile, the balance of stablecoins on exchanges—a key indicator of potential buying pressure—has increased significantly. The report notes that the exchange USDT balance, around $273 million in April, grew to $379 million by August 31, marking a new yearly high. CryptoQuant interprets this surge as a reflection of…
Paylaş
BitcoinEthereumNews2025/09/18 01:01

Trade GOLD, Share 1,000,000 USDT

Trade GOLD, Share 1,000,000 USDTTrade GOLD, Share 1,000,000 USDT

0 fees, up to 1,000x leverage, deep liquidity