The post PHA Price Explodes After Bithumb Listing Sparks Massive Outflows and Whale Activity appeared first on Coinpedia Fintech News PHA price just did what mostThe post PHA Price Explodes After Bithumb Listing Sparks Massive Outflows and Whale Activity appeared first on Coinpedia Fintech News PHA price just did what most

PHA Price Explodes After Bithumb Listing Sparks Massive Outflows and Whale Activity

2026/03/20 23:32
Okuma süresi: 3 dk
Bu içerikle ilgili geri bildirim veya endişeleriniz için lütfen crypto.news@mexc.com üzerinden bizimle iletişime geçin.
Altcoins to Buy Now: Raoul Pal Says These Three Chains Stand Out

The post PHA Price Explodes After Bithumb Listing Sparks Massive Outflows and Whale Activity appeared first on Coinpedia Fintech News

PHA price just did what most altcoins dream of waking up from a nearly doomed stage, even get listed, and immediately rip higher. A fresh KRW trading pair listing on Bithumb lit the fuse, and the reaction wasn’t subtle. We’re talking a sharp intraday move, backed by aggressive on-chain activity and a sudden shift in trader positioning.

And yeah, this isn’t just hype, there’s actual data behind the chaos.

Listing Hype Meets Real Demand

So here’s the deal. The Bithumb listing triggered a classic liquidity event, but instead of just inflows chasing the pump, something more interesting happened tokens started leaving exchanges.

PHA Price Explodes After Bithumb Listing Sparks Massive Outflows and Whale Activity

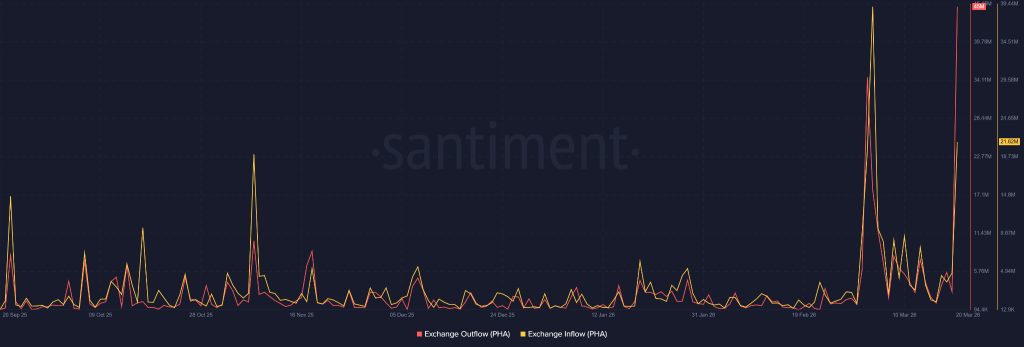
Roughly 45 million PHA flowed out, while inflows lagged behind at 21.62 million. That imbalance screams accumulation. Traders aren’t just flipping; they’re pulling supply off the market, tightening availability, and effectively creating upward pressure.

Well, this kind of behavior usually doesn’t happen unless participants expect higher prices ahead. It’s not retail panic buying; it’s calculated positioning.

Whales And Metrics Flash Bullish

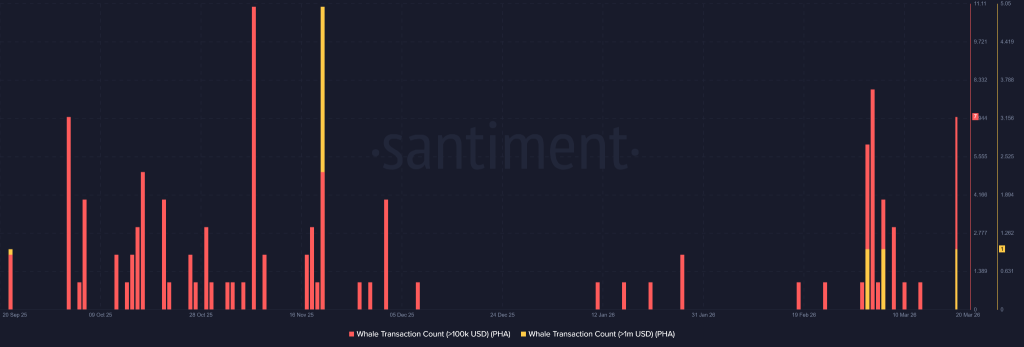
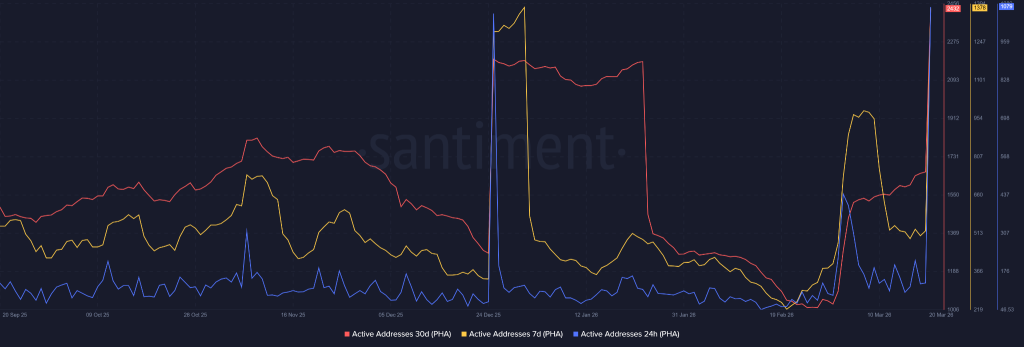
But let’s be real, exchange flows alone don’t tell the full story. Whale activity stepped in hard. Transactions above $100K spiked noticeably, confirming that bigger players weren’t sitting this one out. They showed up and they showed up fast.

PHA Price Explodes After Bithumb Listing Sparks Massive Outflows and Whale Activity

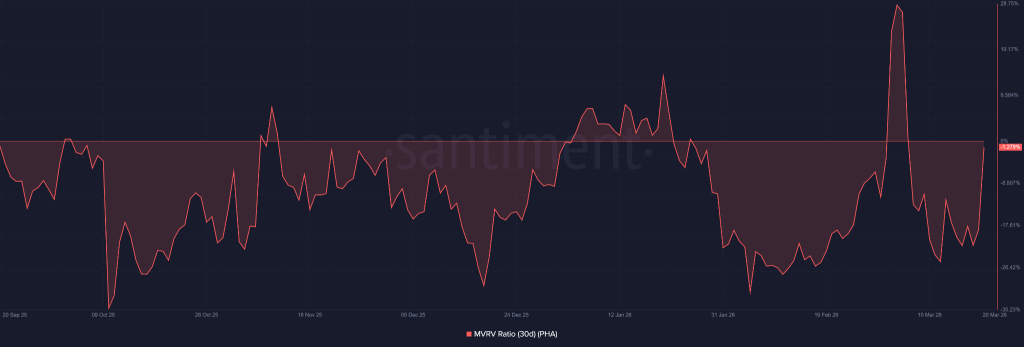
At the same time, the 30-day MVRV ratio surged, dragging average investor positions close to breakeven. That’s important. It means holders who were underwater are now seeing relief, which often reduces immediate sell pressure, at least temporarily.

PHA Price Explodes After Bithumb Listing Sparks Massive Outflows and Whale Activity

Add to that a rise in active addresses, and you’ve got a textbook case of growing network participation. Not just price chasing but shows actual engagement.

PHA Price Explodes After Bithumb Listing Sparks Massive Outflows and Whale Activity

PHA Price Technical Levels Ahead

Now zooming out a bit. This rally didn’t come from nowhere infact the PHA price bounced from a monthly low near $0.021, marking a staggering 110% recovery, and 30% intraday surge. That’s not noise that’s clearly momentum that PHA price has just witnessed.

But momentum needs structure. Right now, the key level sits around $0.053, which aligns with the 200-day EMA. That’s the first real test. If bulls manage to flip it, the next logical targets stack up at $0.075 and $0.091.

PHA Price Explodes After Bithumb Listing Sparks Massive Outflows and Whale Activity

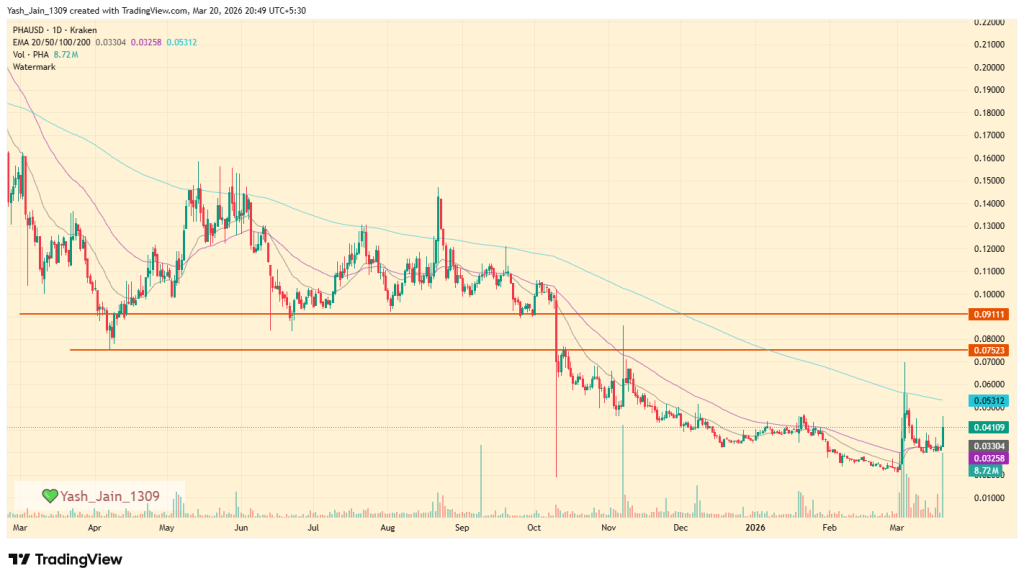
Miss that breakout though? Things get messy again. Simple as that. 

So, what’s next? If demand holds and exchange supply keeps shrinking, this move might have legs. But if the hype fades, as it often does, then PHA price could just as easily stall right where it is.

Piyasa Fırsatı
Phala Logosu
Phala Fiyatı(PHA)
$0.03854
$0.03854$0.03854
+4.07%
USD
Phala (PHA) Canlı Fiyat Grafiği
Sorumluluk Reddi: Bu sitede yeniden yayınlanan makaleler, halka açık platformlardan alınmıştır ve yalnızca bilgilendirme amaçlıdır. MEXC'nin görüşlerini yansıtmayabilir. Tüm hakları telif sahiplerine aittir. Herhangi bir içeriğin üçüncü taraf haklarını ihlal ettiğini düşünüyorsanız, kaldırılması için lütfen crypto.news@mexc.com ile iletişime geçin. MEXC, içeriğin doğruluğu, eksiksizliği veya güncelliği konusunda hiçbir garanti vermez ve sağlanan bilgilere dayalı olarak alınan herhangi bir eylemden sorumlu değildir. İçerik, finansal, yasal veya diğer profesyonel tavsiye niteliğinde değildir ve MEXC tarafından bir tavsiye veya onay olarak değerlendirilmemelidir.

Ayrıca Şunları da Beğenebilirsiniz

Today’s Biggest Crypto Movers: Dogecoin Leads the Pack

Today’s Biggest Crypto Movers: Dogecoin Leads the Pack

Today's Biggest Crypto Movers: Dogecoin Leads the Pack 🚀 Crypto Markets Heat Up Today Major cryptocurrencies are showing strong gains. Let's dive into today's top
Paylaş
Blockchainmagazine2026/04/03 13:00
RWA Boom Accelerates As Tokenized Assets Hit New Highs In Early 2026

RWA Boom Accelerates As Tokenized Assets Hit New Highs In Early 2026

RWA distributed value rose from about $21B to $27.5B in Q1 2026, a gain of roughly 30%. Tokenized US Treasuries reached about $10B, creating an on-chain yield base
Paylaş
LiveBitcoinNews2026/04/03 13:00
Cryptos Signal Divergence Ahead of Fed Rate Decision

Cryptos Signal Divergence Ahead of Fed Rate Decision

The post Cryptos Signal Divergence Ahead of Fed Rate Decision appeared on BitcoinEthereumNews.com. Crypto assets send conflicting signals ahead of the Federal Reserve’s September rate decision. On-chain data reveals a clear decrease in Bitcoin and Ethereum flowing into centralized exchanges, but a sharp increase in altcoin inflows. The findings come from a Tuesday report by CryptoQuant, an on-chain data platform. The firm’s data shows a stark divergence in coin volume, which has been observed in movements onto centralized exchanges over the past few weeks. Bitcoin and Ethereum Inflows Drop to Multi-Month Lows Sponsored Sponsored Bitcoin has seen a dramatic drop in exchange inflows, with the 7-day moving average plummeting to 25,000 BTC, its lowest level in over a year. The average deposit per transaction has fallen to 0.57 BTC as of September. This suggests that smaller retail investors, rather than large-scale whales, are responsible for the recent cash-outs. Ethereum is showing a similar trend, with its daily exchange inflows decreasing to a two-month low. CryptoQuant reported that the 7-day moving average for ETH deposits on exchanges is around 783,000 ETH, the lowest in two months. Other Altcoins See Renewed Selling Pressure In contrast, other altcoin deposit activity on exchanges has surged. The number of altcoin deposit transactions on centralized exchanges was quite steady in May and June of this year, maintaining a 7-day moving average of about 20,000 to 30,000. Recently, however, that figure has jumped to 55,000 transactions. Altcoins: Exchange Inflow Transaction Count. Source: CryptoQuant CryptoQuant projects that altcoins, given their increased inflow activity, could face relatively higher selling pressure compared to BTC and ETH. Meanwhile, the balance of stablecoins on exchanges—a key indicator of potential buying pressure—has increased significantly. The report notes that the exchange USDT balance, around $273 million in April, grew to $379 million by August 31, marking a new yearly high. CryptoQuant interprets this surge as a reflection of…
Paylaş
BitcoinEthereumNews2025/09/18 01:01

Trade GOLD, Share 1,000,000 USDT

Trade GOLD, Share 1,000,000 USDTTrade GOLD, Share 1,000,000 USDT

0 fees, up to 1,000x leverage, deep liquidity