

XRP Price On Shaky Ground As A New Selloff Threatens
XRP price started a downside correction below the $1.1840 zone. The price is now showing bearish signs and might decline further below $1.10.
- XRP price started a downside correction after it failed to stay above the $1.1750 zone.
- The price is now trading below $1.150 and the 100-hourly Simple Moving Average.
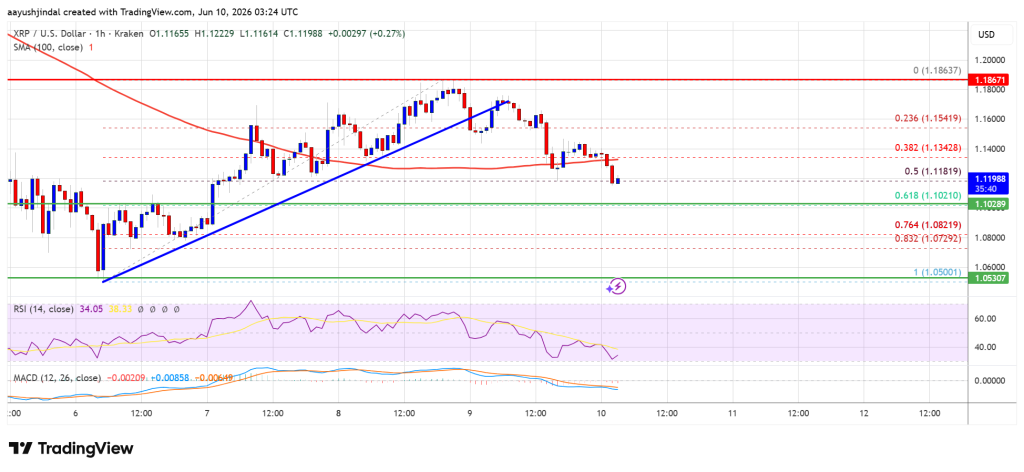
- There was a break below a bullish trend line with support at $1.1620 on the hourly chart of the XRP/USD pair (data source from Kraken).
- The pair could continue to move down if it stays below $1.150.
XRP Price Dips Once Again
XRP price struggled to stay above $1.1620 and started a fresh decline, like Bitcoin and Ethereum. The price dipped below the $1.160 and $1.1550 levels.
There was a break below a bullish trend line with support at $1.1620 on the hourly chart of the XRP/USD pair. The price even traded below the 38.2% Fib retracement level of the upward move from the $1.050 swing low to the $1.1863 high.
The price is now trading below $1.160 and the 100-hourly Simple Moving Average. If there is a fresh upward move, the price might face resistance near the $1.1350 level. The first major resistance is near the $1.1420 level, above which the price could rise and test $1.150.
A clear move above the $1.150 resistance might send the price toward the $1.1580 resistance. Any more gains might send the price toward the $1.1650 resistance. The next major hurdle for the bulls might be near $1.1840.
More Downside?
If XRP fails to clear the $1.150 resistance zone, it could start a fresh decline. Initial support on the downside is near the $1.1020 level or the 61.8% Fib retracement level of the upward move from the $1.050 swing low to the $1.1863 high.
The next major support is near the $1.1072 level. If there is a downside break and a close below the $1.1072 level, the price might continue to decline toward $1.1020. The next major support sits near the $1.10 zone, below which the price could continue lower toward $1.080. Any more losses might call for a test of $1.050.
Technical Indicators
Hourly MACD – The MACD for XRP/USD is now gaining pace in the bearish zone.
Hourly RSI (Relative Strength Index) – The RSI for XRP/USD is now below the 50 level.
Major Support Levels – $1.1020 and $1.080.
Major Resistance Levels – $1.1500 and $1.1840.


Ayrıca Şunları da Beğenebilirsiniz

Kalshi Tightens Insider Trading Rules After Google Engineer and Soldier Cases

Next Big Crypto to Hit $1? Mutuum Finance (MUTM) Prediction 2027-2028

Bitcoin Traders Watching Closely As Trump Hints At Imminent Iran Deal


Popüler Haberler
Daha fazla
