Buy Crypto
Markets
Spot
FuturesBTC
Earn
Event Center
Rewards Hub
More
What Is a Hanging Man Candlestick Pattern? A Beginner's Guide to Identification and TradingWhat Is a Hanging Man Candlestick Pattern? A Beginner's Guide to Identification and Trading
Category List
Cancel

What Is a Hanging Man Candlestick Pattern? A Beginner's Guide to Identification and Trading

Key Takeaways:

  • A hanging man is a single-candlestick pattern that forms after an uptrend and may signal a bearish reversal.
  • It typically has a small body, a long lower shadow, and little or no upper shadow.
  • A hanging man and a hammer have the same shape, but appear in different trend contexts and carry opposite potential reversal signals.
  • A hanging man should be confirmed by subsequent price action, trading volume, or other supporting signals.
  • MEXC's candlestick charting tools allow users to analyze hanging man patterns and other formations when assessing potential exits.

1. What Is a Hanging Man Pattern?


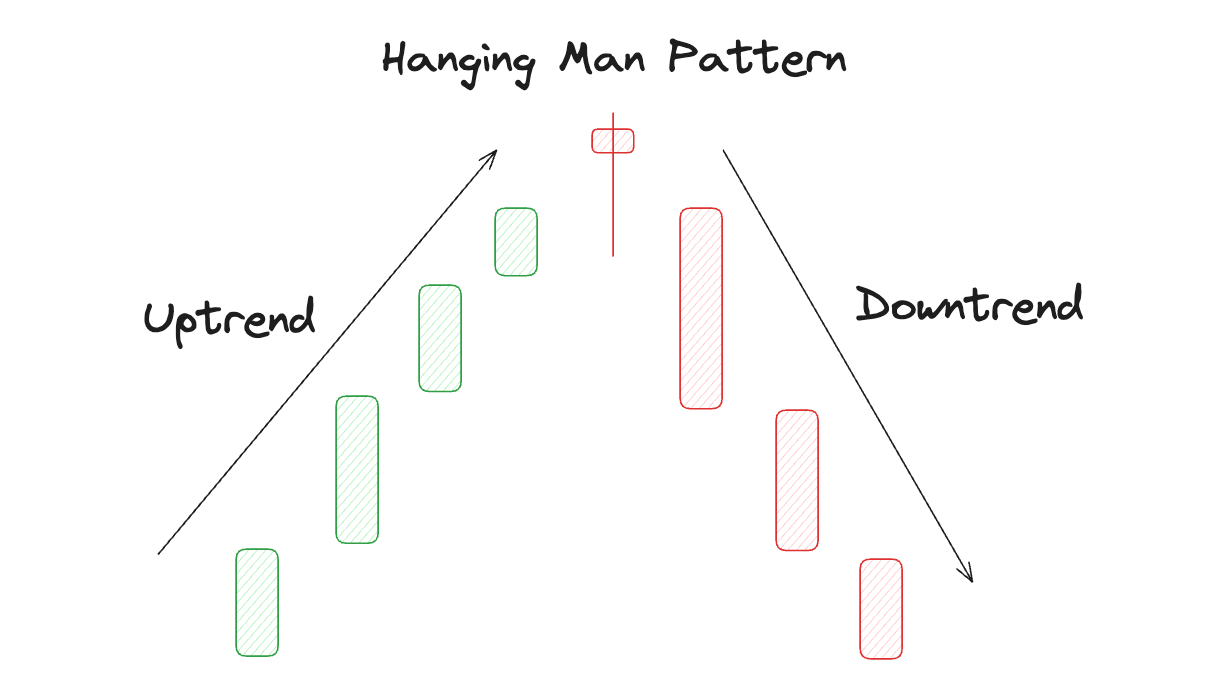
A hanging man is a classic potential bearish reversal candlestick pattern that appears after a clear price advance. It consists of a single candlestick and is named for its resemblance to a hanging figure. Its appearance may suggest that an uptrend is becoming vulnerable and that bullish momentum could be weakening, rather than confirming that the price has already peaked.

The pattern can be used in stock, forex, and cryptocurrency analysis. When trading on MEXC, users can identify it using the platform's built-in candlestick charts.

2. Key Features of a Hanging Man Candlestick


A typical hanging man has three key features:

1) A small body near the top of the trading range. The opening and closing prices are close together, indicating a small difference between two prices over the session. The body can be green, with the close above the open, or red, with the close below the open. A red body is generally considered more bearish.

2) A long lower shadow. The lower shadow should generally be at least twice the length of the body. This is the pattern's defining feature and shows that sellers pushed the price substantially lower during the session before it recovered.

3) Little or no upper shadow. This means the session's high was close to the upper edge of the body, with little or no upper shadow extending beyond the body. In the context of a preceding uptrend, it may add to concerns about weakening upward momentum.

Trend context is essential: the pattern must follow a clear advance to qualify as a hanging man. The same shape after a decline is called a hammer and carries a potential bullish, rather than bearish, reversal signal.

3. How to Confirm a Hanging Man Pattern


A hanging man alone is not enough to justify a trade. Confirmation helps traders distinguish a potential reversal from market noise.

1) Confirmation from the next session's close. On a daily chart, a close below the lower edge of the hanging man's body on the following trading day can provide bearish confirmation. A close above the hanging man's body does not provide bearish confirmation. A longer bearish body on the following candle can offer stronger evidence of selling pressure, but does not guarantee a sustained decline.

2) Volume confirmation. Higher-than-average trading volume during the hanging man session indicates greater market participation but does not independently confirm a bearish reversa. If volume is low, traders should wait for additional confirmation.

3) Supporting resistance levels and technical indicators. A hanging man near an important resistance level may warrant closer attention, especially when accompanied by an overbought Relative Strength Index (RSI) reading or price approaching the upper Bollinger Band. These provide context rather than proof of a reversal. MEXC supports a range of technical indicators that users can combine with candlestick analysis to cross-check a setup.

4. Trading Strategies for the Hanging Man Pattern


Once a hanging man has bearish confirmation, traders can use the following considerations to plan a trade:

1) Entry timing. A more conservative approach is to wait for a subsequent candle to close below the hanging man's low before considering an exit from a long position or an entry into a short position. More aggressive traders may act when price first breaks below that low, but entering before the candle closes involves greater risk.

2) Stop-loss placement. A stop-loss for a short position may be placed above the hanging man's high. A move above that high may invalidate the bearish setup, providing a reference for exiting the trade and limiting losses.

3) Take-profit targets. Previous support levels, Fibonacci retracement levels, or the prior swing low can serve as references for take-profit targets. Assess whether the potential reward is reasonable relative to the risk before entering.

Beginners are advised to practice with demo trading or small positions to understand how hanging man patterns behave in different market conditions before applying them more widely in live trading. MEXC's charting tools let users mark and review historical patterns directly in the trading interface to develop their analysis skills.


5. Hanging Man vs. Similar Candlestick Patterns


Hanging man vs. hammer. Both have a small body and a long lower shadow. The key difference is their position within the trend. A hanging man follows an advance and suggests a potential bearish reversal, while a hammer follows a decline and suggests a potential bullish reversal.

Hanging man vs. shooting star. Both appear after an uptrend and can signal a potential bearish reversal, but their structures differ. A hanging man has a long lower shadow and a body near the top of its range. A shooting star has a long upper shadow and a body near the bottom, showing that buyers pushed the price higher before sellers drove it back down.

Hanging man vs. inverted hammer. An inverted hammer appears after a downtrend and has a long upper shadow with a small body near the bottom of its range. It is a potential bullish reversal pattern, unlike the hanging man's potential bearish signal.

6. Strengths and Limitations of the Hanging Man


Strengths: The pattern consists of a single candlestick, making it relatively easy to recognize. It can provide an early warning of a possible trend change, helping traders assess exits from long positions or potential short entries. It can be applied to different instruments following an uptrend.

Limitations: Similar-looking candles can appear frequently amid market noise, and an unconfirmed pattern may be unreliable. The hanging man does not measure the strength of a subsequent decline and has limited value in sideways markets without a preceding uptrend. Use it with other technical indicators and supporting signals, and apply strict risk management.

7. Hanging Man FAQ


7.1 Is a hanging man bullish or bearish?


It is a potential bearish reversal signal. A hanging man forms after an uptrend and suggests that price may retreat from higher levels. It is not a bullish pattern.

7.2 What does a hanging man pattern mean?


A hanging man shows that significant selling pressure emerged during the session, raising questions about buyers' control and the continuation of the uptrend. If subsequent price action confirms the bearish signal, traders may consider reducing exposure, tighten stop-losses, or prepare for a potential short trade.

7.3 What does a red hanging man indicate?


A red hanging man closes below its opening price. This adds a bearish element to the pattern and is generally considered more bearish than a green hanging man, although color alone does not establish its reliability.

7.4 Is a green hanging man still valid?


Yes. A green hanging man can still be a potential bearish reversal signal when it follows an uptrend. Its close above the open shows that the price recovered from its session low and finished above its opening level, so traders should wait for bearish confirmation rather than act on the pattern alone.

7.5 What if the same pattern appears at the bottom of a downtrend?


The same candlestick shape after a downtrend is a hammer, not a hanging man. In that context, it is a potential bullish reversal signal.

What Is a Hanging Man Candlestick Pattern? A Beginner's Guide to Identification and Trading

Key Takeaways:

  • A hanging man is a single-candlestick pattern that forms after an uptrend and may signal a bearish reversal.
  • It typically has a small body, a long lower shadow, and little or no upper shadow.
  • A hanging man and a hammer have the same shape, but appear in different trend contexts and carry opposite potential reversal signals.
  • A hanging man should be confirmed by subsequent price action, trading volume, or other supporting signals.
  • MEXC's candlestick charting tools allow users to analyze hanging man patterns and other formations when assessing potential exits.

1. What Is a Hanging Man Pattern?


A hanging man is a classic potential bearish reversal candlestick pattern that appears after a clear price advance. It consists of a single candlestick and is named for its resemblance to a hanging figure. Its appearance may suggest that an uptrend is becoming vulnerable and that bullish momentum could be weakening, rather than confirming that the price has already peaked.

The pattern can be used in stock, forex, and cryptocurrency analysis. When trading on MEXC, users can identify it using the platform's built-in candlestick charts.

2. Key Features of a Hanging Man Candlestick


A typical hanging man has three key features:

1) A small body near the top of the trading range. The opening and closing prices are close together, indicating a small difference between two prices over the session. The body can be green, with the close above the open, or red, with the close below the open. A red body is generally considered more bearish.

2) A long lower shadow. The lower shadow should generally be at least twice the length of the body. This is the pattern's defining feature and shows that sellers pushed the price substantially lower during the session before it recovered.

3) Little or no upper shadow. This means the session's high was close to the upper edge of the body, with little or no upper shadow extending beyond the body. In the context of a preceding uptrend, it may add to concerns about weakening upward momentum.

Trend context is essential: the pattern must follow a clear advance to qualify as a hanging man. The same shape after a decline is called a hammer and carries a potential bullish, rather than bearish, reversal signal.


3. How to Confirm a Hanging Man Pattern


A hanging man alone is not enough to justify a trade. Confirmation helps traders distinguish a potential reversal from market noise.

1) Confirmation from the next session's close. On a daily chart, a close below the lower edge of the hanging man's body on the following trading day can provide bearish confirmation. A close above the hanging man's body does not provide bearish confirmation. A longer bearish body on the following candle can offer stronger evidence of selling pressure, but does not guarantee a sustained decline.

2) Volume confirmation. Higher-than-average trading volume during the hanging man session indicates greater market participation but does not independently confirm a bearish reversa. If volume is low, traders should wait for additional confirmation.

3) Supporting resistance levels and technical indicators. A hanging man near an important resistance level may warrant closer attention, especially when accompanied by an overbought Relative Strength Index (RSI) reading or price approaching the upper Bollinger Band. These provide context rather than proof of a reversal. MEXC supports a range of technical indicators that users can combine with candlestick analysis to cross-check a setup.

4. Trading Strategies for the Hanging Man Pattern


Once a hanging man has bearish confirmation, traders can use the following considerations to plan a trade:

1) Entry timing. A more conservative approach is to wait for a subsequent candle to close below the hanging man's low before considering an exit from a long position or an entry into a short position. More aggressive traders may act when price first breaks below that low, but entering before the candle closes involves greater risk.

2) Stop-loss placement. A stop-loss for a short position may be placed above the hanging man's high. A move above that high may invalidate the bearish setup, providing a reference for exiting the trade and limiting losses.

3) Take-profit targets. Previous support levels, Fibonacci retracement levels, or the prior swing low can serve as references for take-profit targets. Assess whether the potential reward is reasonable relative to the risk before entering.

Beginners are advised to practice with demo trading or small positions to understand how hanging man patterns behave in different market conditions before applying them more widely in live trading. MEXC's charting tools let users mark and review historical patterns directly in the trading interface to develop their analysis skills.


5. Hanging Man vs. Similar Candlestick Patterns


Hanging man vs. hammer. Both have a small body and a long lower shadow. The key difference is their position within the trend. A hanging man follows an advance and suggests a potential bearish reversal, while a hammer follows a decline and suggests a potential bullish reversal.

Hanging man vs. shooting star. Both appear after an uptrend and can signal a potential bearish reversal, but their structures differ. A hanging man has a long lower shadow and a body near the top of its range. A shooting star has a long upper shadow and a body near the bottom, showing that buyers pushed the price higher before sellers drove it back down.

Hanging man vs. inverted hammer. An inverted hammer appears after a downtrend and has a long upper shadow with a small body near the bottom of its range. It is a potential bullish reversal pattern, unlike the hanging man's potential bearish signal.

6. Strengths and Limitations of the Hanging Man


Strengths: The pattern consists of a single candlestick, making it relatively easy to recognize. It can provide an early warning of a possible trend change, helping traders assess exits from long positions or potential short entries. It can be applied to different instruments following an uptrend.

Limitations: Similar-looking candles can appear frequently amid market noise, and an unconfirmed pattern may be unreliable. The hanging man does not measure the strength of a subsequent decline and has limited value in sideways markets without a preceding uptrend. Use it with other technical indicators and supporting signals, and apply strict risk management.

7. Hanging Man FAQ


7.1 Is a hanging man bullish or bearish?


It is a potential bearish reversal signal. A hanging man forms after an uptrend and suggests that price may retreat from higher levels. It is not a bullish pattern.

7.2 What does a hanging man pattern mean?


A hanging man shows that significant selling pressure emerged during the session, raising questions about buyers' control and the continuation of the uptrend. If subsequent price action confirms the bearish signal, traders may consider reducing exposure, tighten stop-losses, or prepare for a potential short trade.

7.3 What does a red hanging man indicate?


A red hanging man closes below its opening price. This adds a bearish element to the pattern and is generally considered more bearish than a green hanging man, although color alone does not establish its reliability.

7.4 Is a green hanging man still valid?


Yes. A green hanging man can still be a potential bearish reversal signal when it follows an uptrend. Its close above the open shows that the price recovered from its session low and finished above its opening level, so traders should wait for bearish confirmation rather than act on the pattern alone.

7.5 What if the same pattern appears at the bottom of a downtrend?


The same candlestick shape after a downtrend is a hammer, not a hanging man. In that context, it is a potential bullish reversal signal.