

How to Use Volume Ratio (VR) Indicator in Trading: A Complete Beginner's Guide
Key Takeaways:
- Volume Ratio (VR) is a technical indicator that compares trading volume during price increases and declines to measure changes in buying and selling activity.
- VR calculates the ratio between accumulated volume during price increases and declines over a specific period.
- VR values are commonly divided into four zones: oversold, normal, overbought, and warning zones, each providing different trading signals.
- VR can provide early signals for potential market reversals, but should be combined with other indicators for confirmation.
- MEXC users can add VR and other volume-based indicators to candlestick charts for trading analysis.
1. What Is Volume Ratio (VR)?
Volume Ratio (VR) is a technical analysis indicator based on trading volume. It is built on the idea that price increases are often accompanied by higher trading volume, while price declines may occur with weaker volume activity.
VR compares the accumulated trading volume during price increases with the accumulated trading volume during price declines over a specific period. This helps traders evaluate the balance between buying and selling activity and identify whether the market may be overbought or oversold.
A higher VR value suggests stronger buying activity, while a lower VR value indicates stronger selling pressure. For beginners, VR provides a simple way to understand changes in supply and demand.
2. How to Interpret VR Values
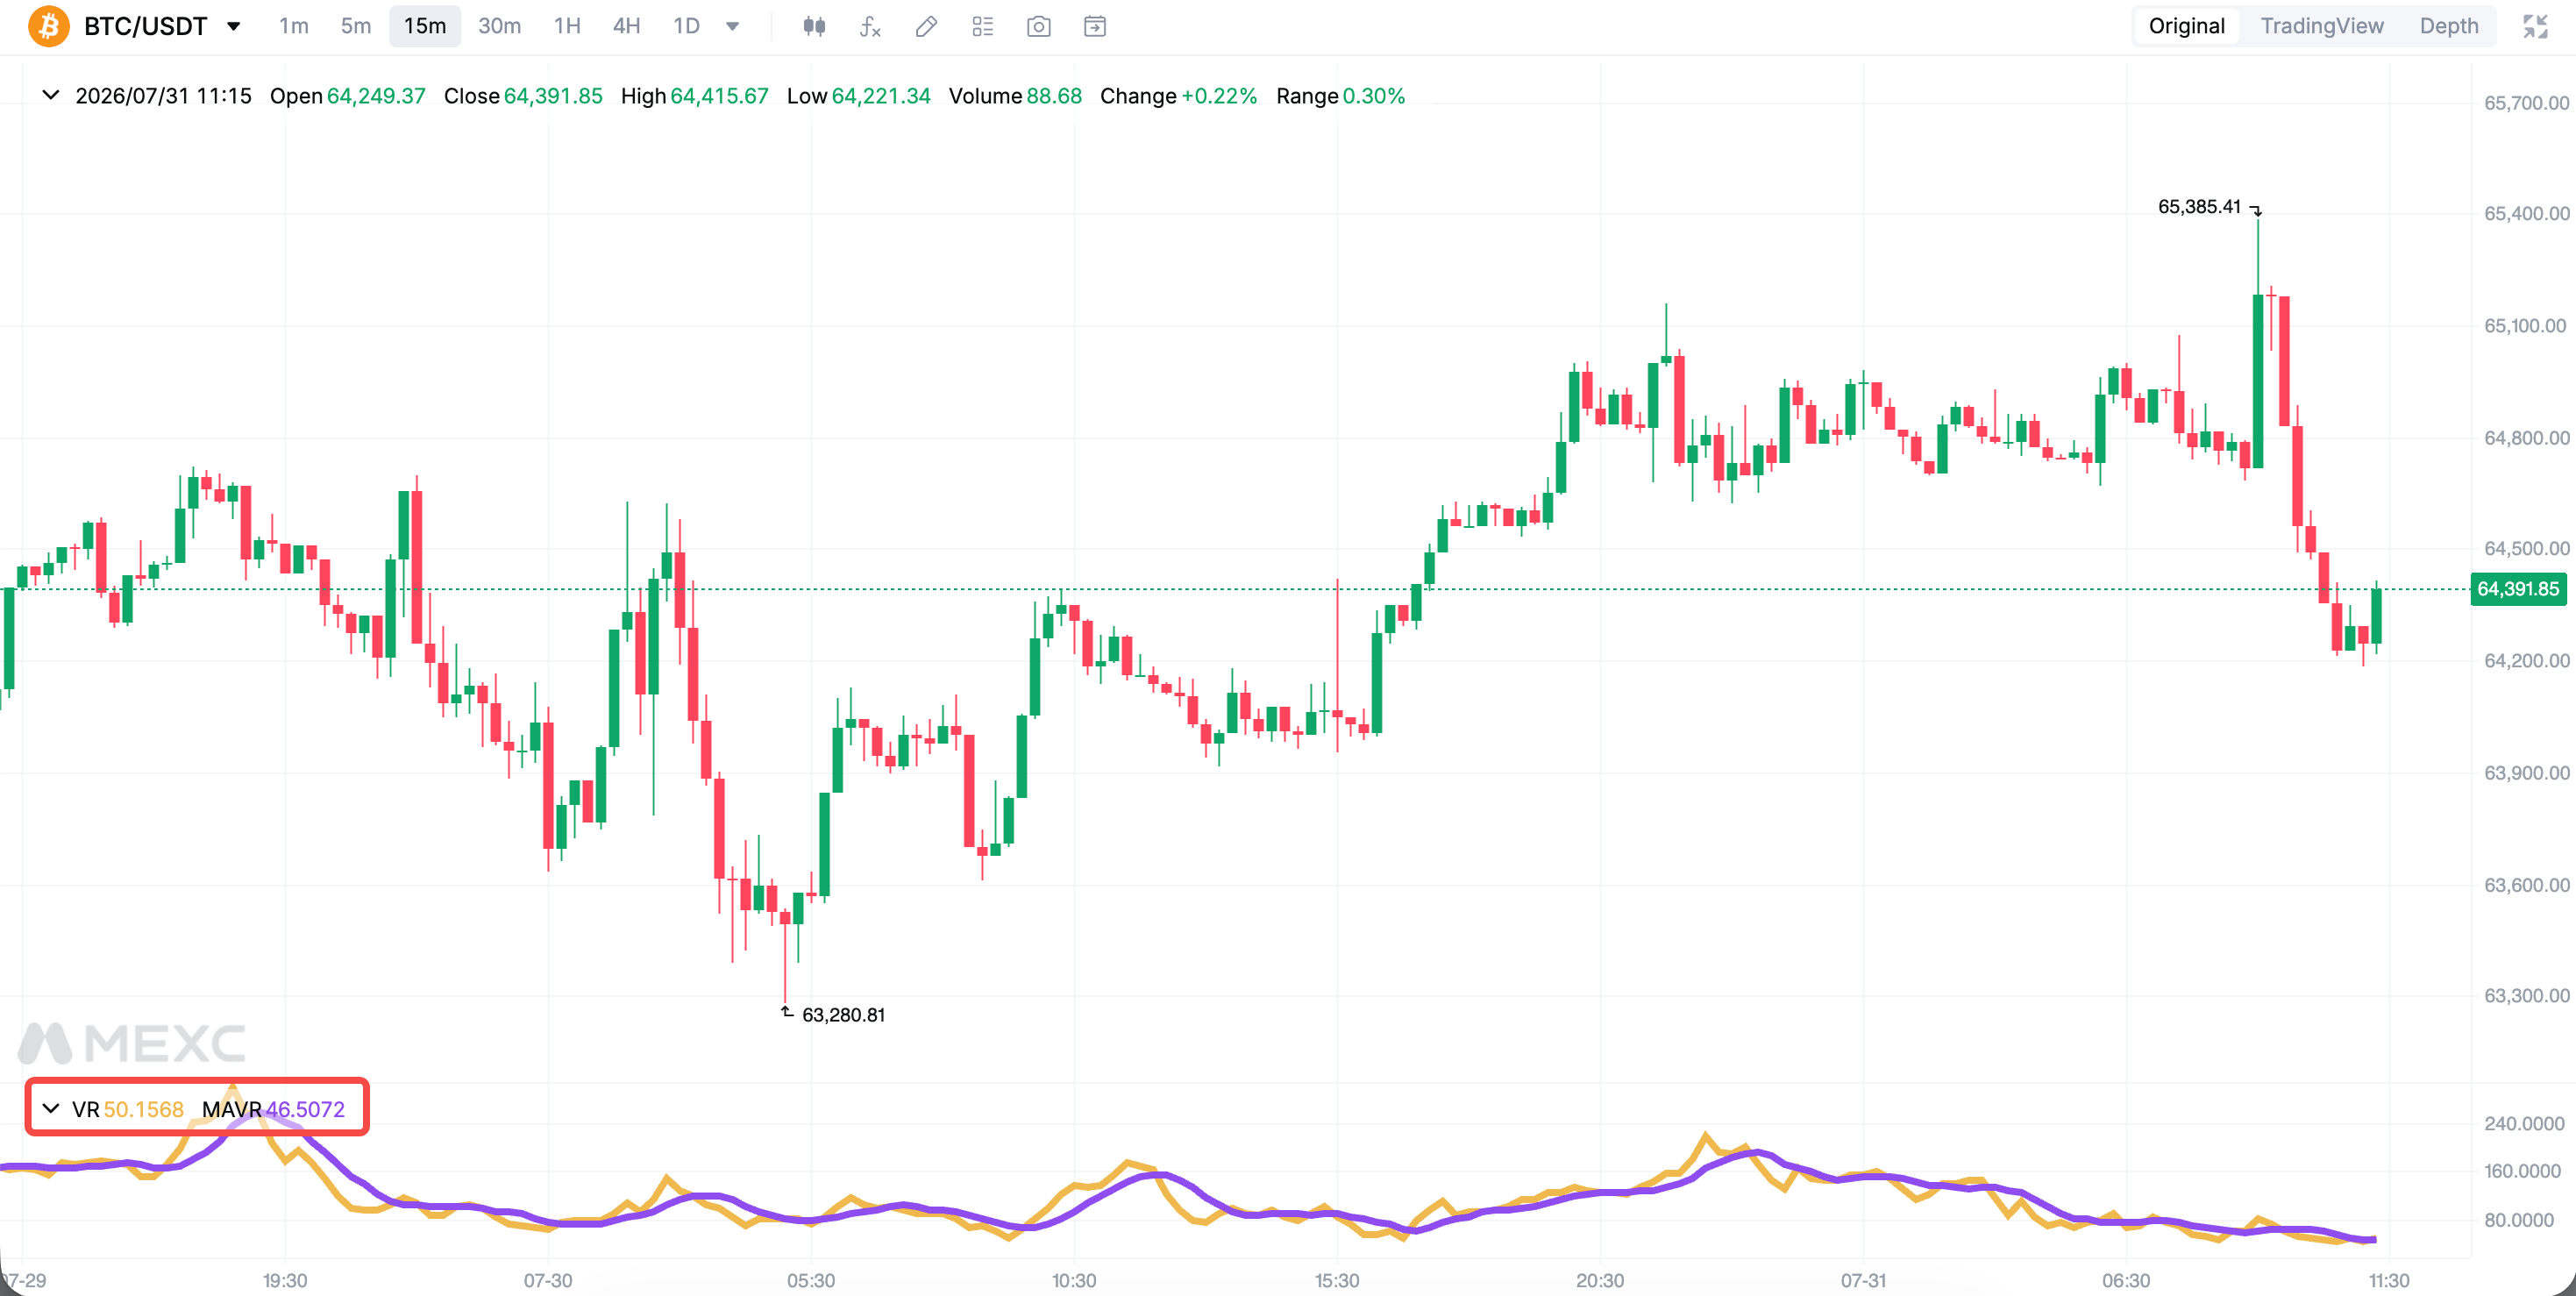
VR is mainly interpreted based on different value ranges:
Normal Range (80%–350%): When VR remains within this range, buying and selling activity is relatively balanced. Price movements are usually more stable, and traders may wait for clearer signals before making decisions.
Oversold Range (Below 60%): When VR falls below 60%, it indicates strong selling pressure and potentially oversold market conditions. At this stage, selling activity may be approaching exhaustion, indicating the possibility of a rebound.
Overbought Range (Above 350%): When VR rises above 350%, it suggests strong buying activity and excessive market enthusiasm. The market may enter an overbought condition, increasing the risk of chasing prices at high levels. Traders may consider managing positions and monitoring potential pullbacks.
Warning Range (550%–700%): When VR reaches 550%–700%, buying activity may become excessive and approach exhaustion. This range may indicate a higher risk of a market top and potential reversal.
3. How to Use VR in Trading
3.1 Identify Potential Entry and Exit Opportunities
When VR enters an oversold range, traders can monitor potential rebound opportunities. When VR reaches overbought or warning ranges, traders may consider taking profits or reducing exposure.
VR is generally more useful when identifying oversold conditions. At high levels, VR should be combined with other indicators for confirmation.
3.2 Identify Volume-Price Divergence
When price reaches a new high but VR fails to reach a new high, it may indicate weakening buying activity and a potential reversal risk. When price reaches a new low but VR does not continue declining, it may suggest that selling pressure is weakening and a potential bottom may be forming.
Divergence signals can provide useful references when identifying possible market turning points.
3.3 Analyze Changes in Market Activity
A sharp increase in VR may indicate that significant trading activity is entering the market. When a rapid VR increase is accompanied by a breakout above key resistance levels, it may suggest stronger upward momentum and increased market activity.
3.4 Combine VR with Other Indicators
VR should not be used as a standalone signal. Traders can combine it with other technical indicators, such as Moving Average, Bollinger Bands, and Relative Strength Index (RSI).
For example, when VR moves upward from oversold levels and price breaks above a moving average, the signal may become more reliable.
Traders should also apply proper risk management, including setting stop-loss levels and controlling position sizes.
4. How to Use VR on MEXC
MEXC provides advanced candlestick charts and technical analysis tools to help users analyze market conditions. Users can add the VR indicator directly from the chart interface.
5. Things to Consider When Using VR
1) VR is a supporting technical indicator and cannot guarantee accurate predictions. Unexpected market events may cause signals to become less effective.
2) VR reference levels may vary depending on different timeframes and assets.
3) VR signals at extremely high levels may become less reliable and should be combined with other indicators.
4) Every trading decision involves risk. Traders should set appropriate stop-loss levels, manage position sizes, and avoid excessive trading.
6. VR FAQ
6.1 How can I use VR?
1) Check the VR range:
- Below 60%: Potential oversold conditions
- Above 350%: Potential overbought conditions
2) Look for volume-price divergence signals.
3) Confirm signals with other technical indicators before making trading decisions.
6.2 How should I interpret VR values?
1) 80%–350%: Normal range
2) Below 60%: Oversold range
3) Above 350%: Overbought range
4) 550%–700%: Warning range with higher reversal risk
6.3 What assets are suitable for VR analysis?
VR is more suitable for assets with active trading volume and sufficient liquidity, such as major cryptocurrencies.
For assets with low trading activity or limited volatility, VR signals may provide less meaningful references.
6.4 What is the difference between VR and Relative Volume?
VR measures the relationship between trading volume during price increases and declines, helping evaluate buying and selling activity.
Relative Volume compares current trading volume with historical average volume to identify unusual changes in market activity.
The two indicators focus on different aspects of volume analysis and can complement each other.
6.5 Can VR be used as the only trading signal?
No. VR should not be used alone to make trading decisions. Traders should combine VR with price action, other technical indicators, and proper risk management strategies.
Recommended Reading:
Risk Disclaimer: Technical indicators are calculated based on historical data and are provided for reference only. They do not guarantee future market movements. Digital asset markets are highly volatile and involve risks. Please make independent decisions based on your own risk tolerance and carefully evaluate potential risks before trading.