Buy Crypto
Markets
Spot
FuturesBTC
Earn
Event Center
Rewards Hub
More
How to Use Volume Rate of Change (VROC) in U.S. Stock Trading: A Complete Beginner's GuideHow to Use Volume Rate of Change (VROC) in U.S. Stock Trading: A Complete Beginner's Guide
Category List
Cancel

How to Use Volume Rate of Change (VROC) in U.S. Stock Trading: A Complete Beginner's Guide

Key Takeaways:

  • Volume Rate of Change (VROC) measures the percentage change in trading volume over a specified lookback period, helping traders assess changes in market participation.
  • VROC fluctuates around zero. Positive values indicate higher volume than the comparison period, while negative values indicate lower volume. Neither reading indicates price direction on its own.
  • In U.S. stock trading, VROC can help assess volume support for breakouts and highlight changes in participation that may warrant closer attention to potential reversals.
  • VROC depends on accurate volume data and can be affected by market noise in sideways markets. Interpret it alongside price structure and other indicators rather than using it alone.
  • Common lookback settings include 12 or 25 periods. VROC and the cumulative On-Balance Volume indicator offer different perspectives and can be used together for a broader view of trading volume.

1. What Is Volume Rate of Change?


Volume Rate of Change (VROC) is a technical analysis tool that measures the percentage change in trading volume over a specified lookback period.

VROC works similarly to the price Rate of Change indicator, but analyzes volume rather than price. Significant chart formations, such as tops, bottoms, and breakouts, often coincide with increased trading volume. VROC can help traders identify these changes in activity as they develop.

For beginner U.S. Stock traders, VROC's key value is its view of market participation. A positive reading means current volume exceeds volume in the comparison period, while a negative reading means it is lower. Greater activity may support a price move in either direction; reduced activity may suggest weaker participation, but does not by itself confirm that a trend is ending.
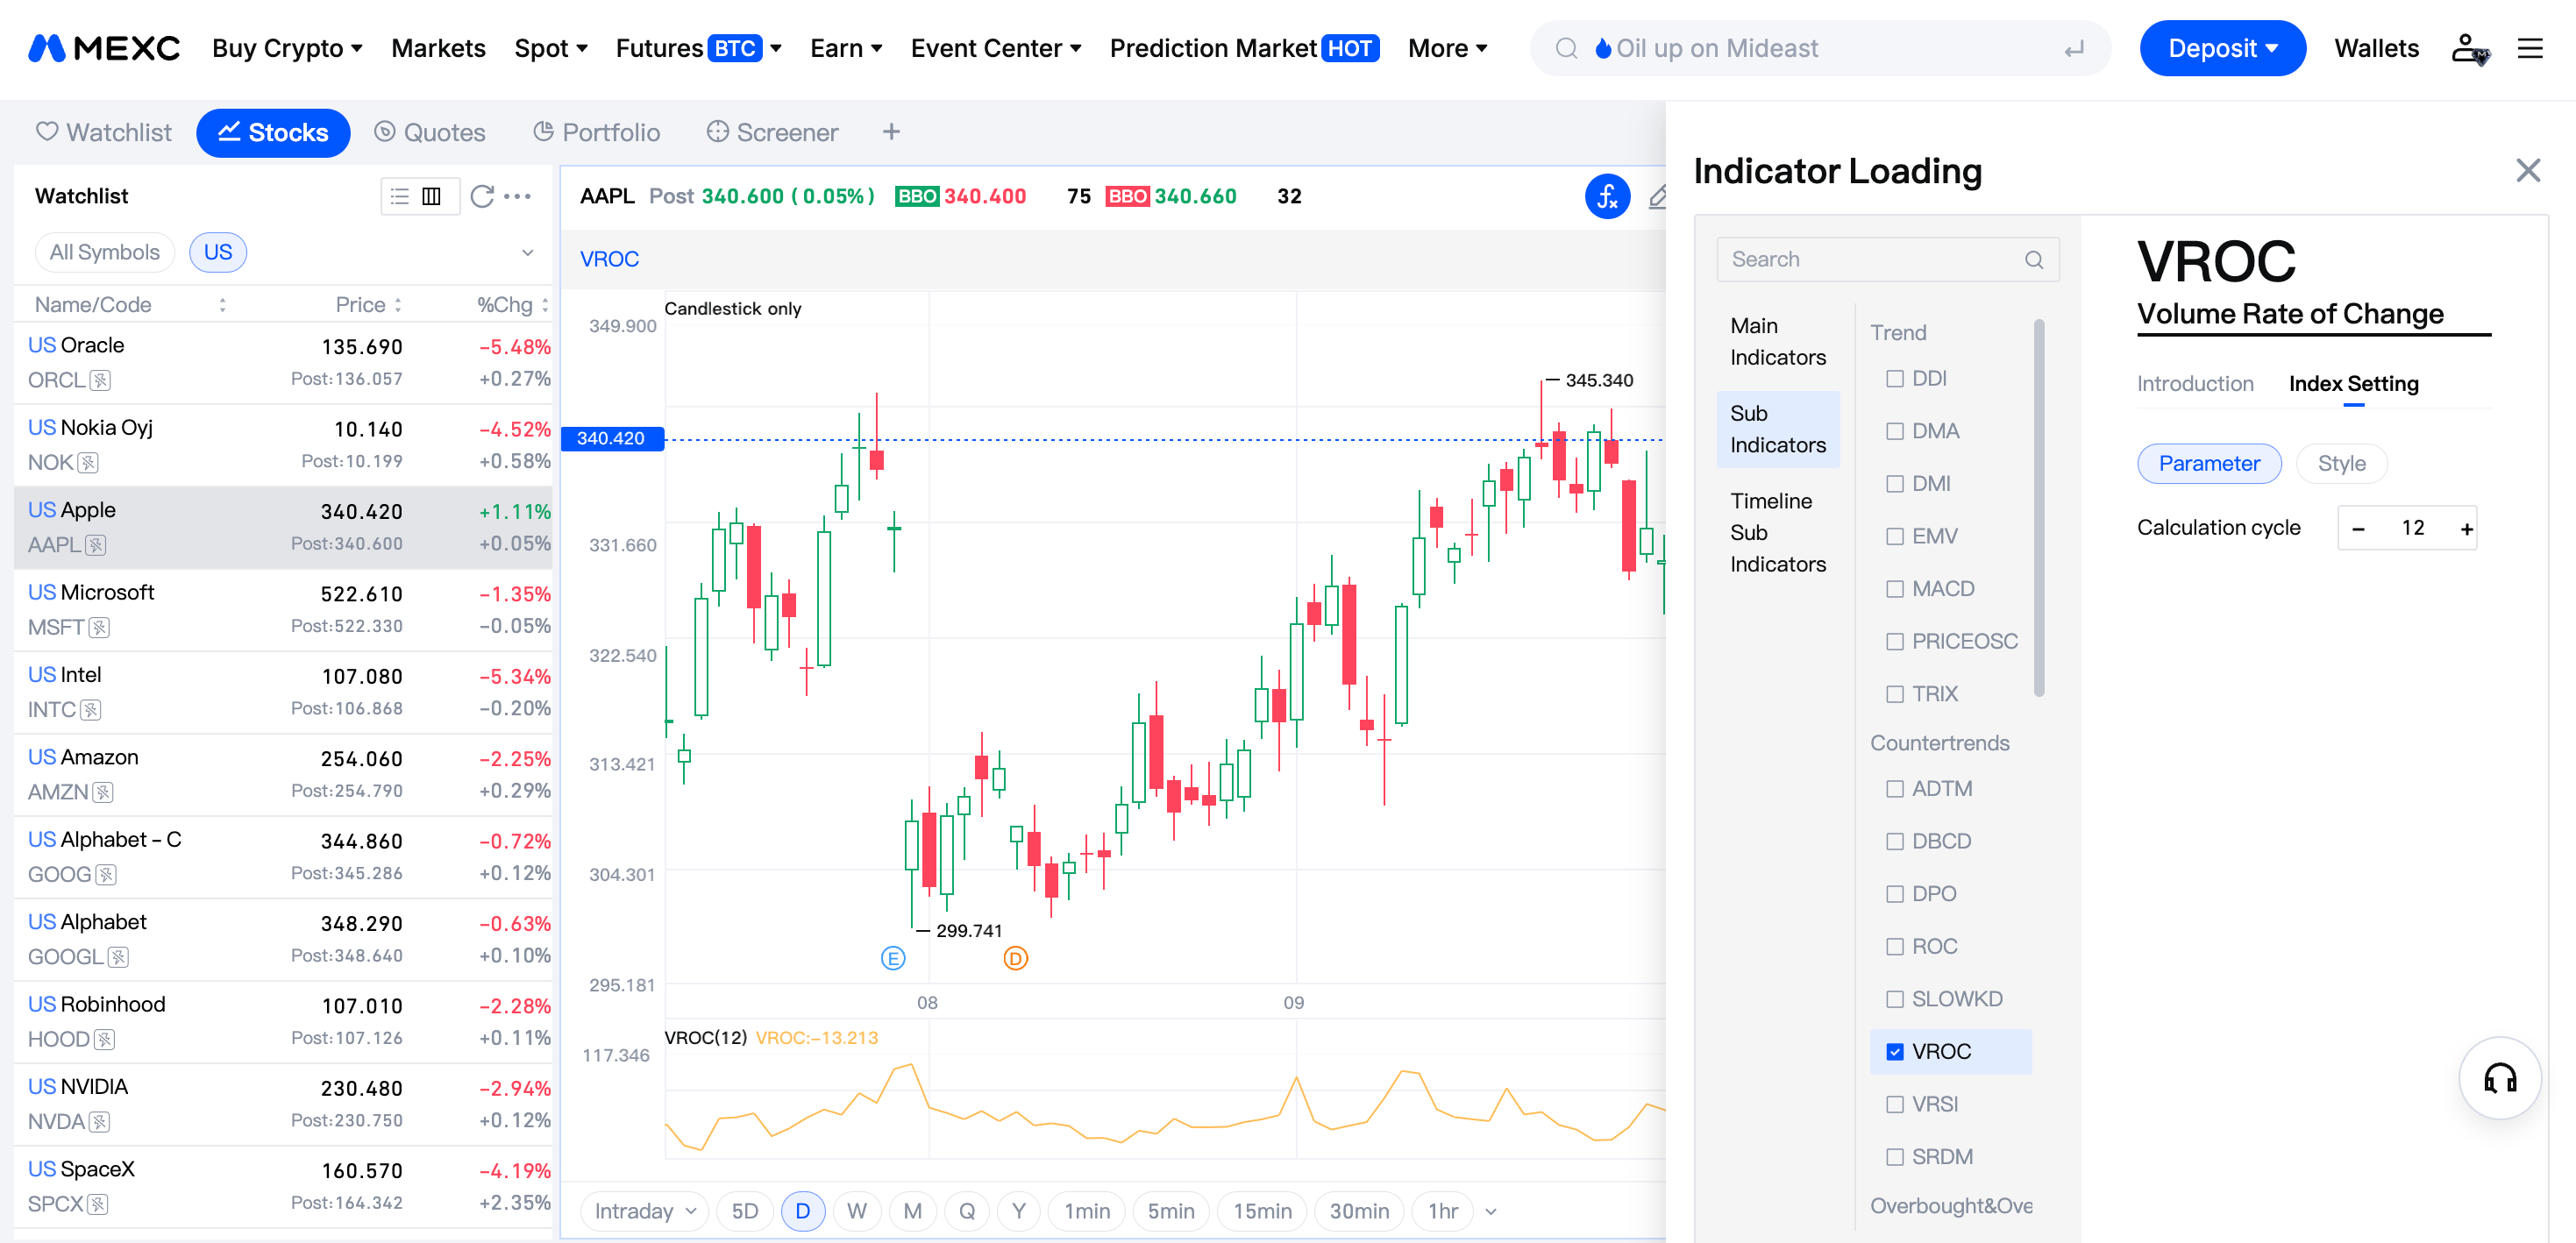

2. How to Interpret VROC: Confirmation and Divergence


VROC fluctuates above and below the zero line. A positive reading shows that current volume is higher than volume a specified number of periods ago. A negative reading shows that it is lower. A rising or falling VROC reflects a change in this comparison, not necessarily a rise or fall in price. Positive VROC can accompany either buying-driven rallies or selling-driven declines.

1) Confirmation: When a price move is accompanied by increased volume relative to the lookback period, VROC can provide supporting evidence of greater participation. This applies to both upward and downward moves. Confirmation does not require price and VROC to move in the same direction.

2) Divergence: When price reaches a new high but VROC forms a lower high, it may indicate weakening volume momentum behind the price increase. Conversely, when price reaches a new low but VROC forms a higher low, it may suggest a change in volume momentum. However, neither pattern predicts a price reversal, as VROC measures changes in trading volume rather than buying or selling pressure.

Importantly, VROC does not indicate price direction or directly measure price volatility. It measures changes in trading volume and must be interpreted alongside price action.

3. How to Use VROC in U.S. Stock Trading


1) Breakout trading. When a stock breaks above resistance and VROC rises sharply into positive territory, the increase in volume may support the breakout and help traders assess a potential long entry. If price reaches a new high without a corresponding increase in volume, the breakout has less volume confirmation and warrants caution. Similarly, a break below support accompanied by a sharp positive VROC reading may support a bearish breakout. Volume confirmation does not guarantee that either breakout will continue.

2) Reversal trading. Traders can compare price action with VROC to assess changes in participation around potential turning points. After a strong advance, a move from positive to negative VROC means volume has fallen below the lookback-period level; it does not predict a pullback. After a sustained decline, a recovery in VROC likewise does not establish a bullish reversal. In either case, a reversal setup needs confirmation from price structure before it can be perceived as a potential entry opportunity.

Whichever approach you use, set stop-losses, manage position size, and test your rules in a simulated environment before applying them to live trades. MEXC's U.S. stock trading interface provides charting and risk management tools that can help beginners gradually develop their trading approach.


4. Important Considerations When Using VROC


1) VROC depends on accurate trading volume data. It is most useful when the data reliably represents trading activity in the market being analyzed.

2) In sideways markets, fluctuations in volume can create market noise and make VROC harder to interpret. A clear price trend can provide more context, but VROC is not a standalone trend signal.

3) VROC is a supporting tool, not an independent basis for buying or selling. Use it with price structure, support and resistance, and other indicators, and always apply appropriate risk controls.

5. Volume Rate of Change FAQ


5.1 What is Volume Rate of Change?


Volume Rate of Change measures the percentage difference between current trading volume and volume a specified number of periods ago. It helps traders assess changes in market participation.

5.2 What does VROC stand for?


VROC stands for Volume Rate of Change. It is a volume-based momentum oscillator that fluctuates around zero.

5.3 What are the best settings for VROC?


Common lookback settings include 12 or 25 periods. Shorter settings tend to respond more quickly but may produce more market noise, while longer settings provide a longer-term comparison. There is no universally best setting; test and adjust the lookback period to suit your trading timeframe.

5.4 Is On-Balance Volume useful, and how does it differ from VROC?


On-Balance Volume (OBV) is a cumulative indicator that adds or subtracts volume according to the direction of the closing price change. VROC instead measures the percentage change in volume over a lookback period, without assigning it a price direction. The two provide different perspectives and can be used together for a broader view of volume activity.

5.5 Where can I practice using VROC?


You can use MEXC's U.S. stock charting tools to analyze price and volume together, apply VROC in your trading analysis, and gradually refine your strategy.

How to Use Volume Rate of Change (VROC) in U.S. Stock Trading: A Complete Beginner's Guide

Key Takeaways:

  • Volume Rate of Change (VROC) measures the percentage change in trading volume over a specified lookback period, helping traders assess changes in market participation.
  • VROC fluctuates around zero. Positive values indicate higher volume than the comparison period, while negative values indicate lower volume. Neither reading indicates price direction on its own.
  • In U.S. stock trading, VROC can help assess volume support for breakouts and highlight changes in participation that may warrant closer attention to potential reversals.
  • VROC depends on accurate volume data and can be affected by market noise in sideways markets. Interpret it alongside price structure and other indicators rather than using it alone.
  • Common lookback settings include 12 or 25 periods. VROC and the cumulative On-Balance Volume indicator offer different perspectives and can be used together for a broader view of trading volume.

1. What Is Volume Rate of Change?


Volume Rate of Change (VROC) is a technical analysis tool that measures the percentage change in trading volume over a specified lookback period.

VROC works similarly to the price Rate of Change indicator, but analyzes volume rather than price. Significant chart formations, such as tops, bottoms, and breakouts, often coincide with increased trading volume. VROC can help traders identify these changes in activity as they develop.

For beginner U.S. Stock traders, VROC's key value is its view of market participation. A positive reading means current volume exceeds volume in the comparison period, while a negative reading means it is lower. Greater activity may support a price move in either direction; reduced activity may suggest weaker participation, but does not by itself confirm that a trend is ending.


2. How to Interpret VROC: Confirmation and Divergence


VROC fluctuates above and below the zero line. A positive reading shows that current volume is higher than volume a specified number of periods ago. A negative reading shows that it is lower. A rising or falling VROC reflects a change in this comparison, not necessarily a rise or fall in price. Positive VROC can accompany either buying-driven rallies or selling-driven declines.

1) Confirmation: When a price move is accompanied by increased volume relative to the lookback period, VROC can provide supporting evidence of greater participation. This applies to both upward and downward moves. Confirmation does not require price and VROC to move in the same direction.

2) Divergence: When price reaches a new high but VROC forms a lower high, it may indicate weakening volume momentum behind the price increase. Conversely, when price reaches a new low but VROC forms a higher low, it may suggest a change in volume momentum. However, neither pattern predicts a price reversal, as VROC measures changes in trading volume rather than buying or selling pressure.

Importantly, VROC does not indicate price direction or directly measure price volatility. It measures changes in trading volume and must be interpreted alongside price action.

3. How to Use VROC in U.S. Stock Trading


1) Breakout trading. When a stock breaks above resistance and VROC rises sharply into positive territory, the increase in volume may support the breakout and help traders assess a potential long entry. If price reaches a new high without a corresponding increase in volume, the breakout has less volume confirmation and warrants caution. Similarly, a break below support accompanied by a sharp positive VROC reading may support a bearish breakout. Volume confirmation does not guarantee that either breakout will continue.

2) Reversal trading. Traders can compare price action with VROC to assess changes in participation around potential turning points. After a strong advance, a move from positive to negative VROC means volume has fallen below the lookback-period level; it does not predict a pullback. After a sustained decline, a recovery in VROC likewise does not establish a bullish reversal. In either case, a reversal setup needs confirmation from price structure before it can be perceived as a potential entry opportunity.

Whichever approach you use, set stop-losses, manage position size, and test your rules in a simulated environment before applying them to live trades. MEXC's U.S. stock trading interface provides charting and risk management tools that can help beginners gradually develop their trading approach.


4. Important Considerations When Using VROC


1) VROC depends on accurate trading volume data. It is most useful when the data reliably represents trading activity in the market being analyzed.

2) In sideways markets, fluctuations in volume can create market noise and make VROC harder to interpret. A clear price trend can provide more context, but VROC is not a standalone trend signal.

3) VROC is a supporting tool, not an independent basis for buying or selling. Use it with price structure, support and resistance, and other indicators, and always apply appropriate risk controls.

5. Volume Rate of Change FAQ


5.1 What is Volume Rate of Change?


Volume Rate of Change measures the percentage difference between current trading volume and volume a specified number of periods ago. It helps traders assess changes in market participation.

5.2 What does VROC stand for?


VROC stands for Volume Rate of Change. It is a volume-based momentum oscillator that fluctuates around zero.

5.3 What are the best settings for VROC?


Common lookback settings include 12 or 25 periods. Shorter settings tend to respond more quickly but may produce more market noise, while longer settings provide a longer-term comparison. There is no universally best setting; test and adjust the lookback period to suit your trading timeframe.

5.4 Is On-Balance Volume useful, and how does it differ from VROC?


On-Balance Volume (OBV) is a cumulative indicator that adds or subtracts volume according to the direction of the closing price change. VROC instead measures the percentage change in volume over a lookback period, without assigning it a price direction. The two provide different perspectives and can be used together for a broader view of volume activity.

5.5 Where can I practice using VROC?


You can use MEXC's U.S. stock charting tools to analyze price and volume together, apply VROC in your trading analysis, and gradually refine your strategy.