Ostium Research’s latest weekly note opened with Bitcoin under pressure after a swift selloff into the new week, describing “a mass liquidation event” that pushed price as low as $111,761, after rejection near resistance in the mid-$117,000s. The team frames the drawdown as part of a previously flagged “window of weakness… into early October,” while stressing the higher-timeframe uptrend remains intact unless key weekly levels fail. The report, published September 22, 2025, sets out both the technical map and the event calendar that could govern path-dependency over the next several sessions. Bitcoin Crash To $99,000 Looms On the weekly chart, Ostium notes last week’s consolidation around the August open and a wick into “key resistance… at $117.5k,” followed by a close marginally below the open. Early-week price action then carried price beneath reclaimed support into the $111k handle, with the analysts highlighting “over $1.6bn in longs liquidated so far today.” Two structural inflection zones anchor the bearish risk: “Acceptance below $107k on a weekly close would open up more downside into $99k,” whereas on the topside “the weekly high at $115.3k… is at least revisited some time later in the week.” Related Reading: Bitcoin Fear & Greed Index Signals ‘Fear’ As Price Falls To $112,000 On the daily timeframe, the August open at $115.7k is the pivot the market must reclaim to reassert momentum. As the authors put it, “that August open at $115.7k [is] a key level to flip into support to resume bullishness.” The immediate battleground is the prior all-time high at $112k, where “a reclaim of $112k as support” would tilt probabilities toward a higher low and force shorts to cover into a move back through $115.7k. Their base case, however, is for additional chop “between $112k-$115k before a second push lower below today’s low,” which will determine whether the market undercuts the June swing at $107k or marks out a bottom sooner. Tactically, Ostium lays out both long and short triggers with unusual clarity. On the long side: “a sweep of today’s low early this week and then a reclaim of $112k as support,” riding momentum “back into the weekly high.” On the short side, they float what they call “a really nice short setup… a sharp v-reversal… back above the weekly high… before… rejecting and breaking back below $115.3k,” which would then target “$112k and lower.” In other words, a squeeze-then-fade path that punishes both late longs and late shorts. Related Reading: Bitcoin Stuck In Neutral While Markets Roar — Analyst Explains Why Positioning and derivatives breadth round out the near-term blueprint. The note shares snapshots of 3-month annualized basis, Bitcoin versus altcoin open interest, and one-week/one-month liquidation maps, underscoring how quickly liquidity pockets can flip into magnets in thin conditions. This informs their near-term expectation that “the next leg lower or second liquidation event this week [could] be a high probability low,” followed by a retest of $115.3k that will act as the tape’s verdict on whether another down-leg or a bear-trap reversal is in play into quarter-end. The house view remains probabilistic rather than doctrinaire. If $107k fails on a weekly close, the weakness window could extend into “$99k”; if it holds—and especially if the market can “flip $115.7k into support”—the higher-low narrative stays alive. In the authors’ words, for Ethereum “nothing about this higher timeframe structure or momentum is currently giga-bearish,” and, by analogy, Bitcoin’s structure is best judged by the reaction around $111.7k–$112k this week. Whether today’s flush proves to be prelude to capitulation or the trap before new highs, Ostium’s bottom line is clear: “we move much higher from early October” unless those weekly thresholds are accepted lower. At press time, BTC traded at $113,002. Featured image created with DALL.E, chart from TradingView.comOstium Research’s latest weekly note opened with Bitcoin under pressure after a swift selloff into the new week, describing “a mass liquidation event” that pushed price as low as $111,761, after rejection near resistance in the mid-$117,000s. The team frames the drawdown as part of a previously flagged “window of weakness… into early October,” while stressing the higher-timeframe uptrend remains intact unless key weekly levels fail. The report, published September 22, 2025, sets out both the technical map and the event calendar that could govern path-dependency over the next several sessions. Bitcoin Crash To $99,000 Looms On the weekly chart, Ostium notes last week’s consolidation around the August open and a wick into “key resistance… at $117.5k,” followed by a close marginally below the open. Early-week price action then carried price beneath reclaimed support into the $111k handle, with the analysts highlighting “over $1.6bn in longs liquidated so far today.” Two structural inflection zones anchor the bearish risk: “Acceptance below $107k on a weekly close would open up more downside into $99k,” whereas on the topside “the weekly high at $115.3k… is at least revisited some time later in the week.” Related Reading: Bitcoin Fear & Greed Index Signals ‘Fear’ As Price Falls To $112,000 On the daily timeframe, the August open at $115.7k is the pivot the market must reclaim to reassert momentum. As the authors put it, “that August open at $115.7k [is] a key level to flip into support to resume bullishness.” The immediate battleground is the prior all-time high at $112k, where “a reclaim of $112k as support” would tilt probabilities toward a higher low and force shorts to cover into a move back through $115.7k. Their base case, however, is for additional chop “between $112k-$115k before a second push lower below today’s low,” which will determine whether the market undercuts the June swing at $107k or marks out a bottom sooner. Tactically, Ostium lays out both long and short triggers with unusual clarity. On the long side: “a sweep of today’s low early this week and then a reclaim of $112k as support,” riding momentum “back into the weekly high.” On the short side, they float what they call “a really nice short setup… a sharp v-reversal… back above the weekly high… before… rejecting and breaking back below $115.3k,” which would then target “$112k and lower.” In other words, a squeeze-then-fade path that punishes both late longs and late shorts. Related Reading: Bitcoin Stuck In Neutral While Markets Roar — Analyst Explains Why Positioning and derivatives breadth round out the near-term blueprint. The note shares snapshots of 3-month annualized basis, Bitcoin versus altcoin open interest, and one-week/one-month liquidation maps, underscoring how quickly liquidity pockets can flip into magnets in thin conditions. This informs their near-term expectation that “the next leg lower or second liquidation event this week [could] be a high probability low,” followed by a retest of $115.3k that will act as the tape’s verdict on whether another down-leg or a bear-trap reversal is in play into quarter-end. The house view remains probabilistic rather than doctrinaire. If $107k fails on a weekly close, the weakness window could extend into “$99k”; if it holds—and especially if the market can “flip $115.7k into support”—the higher-low narrative stays alive. In the authors’ words, for Ethereum “nothing about this higher timeframe structure or momentum is currently giga-bearish,” and, by analogy, Bitcoin’s structure is best judged by the reaction around $111.7k–$112k this week. Whether today’s flush proves to be prelude to capitulation or the trap before new highs, Ostium’s bottom line is clear: “we move much higher from early October” unless those weekly thresholds are accepted lower. At press time, BTC traded at $113,002. Featured image created with DALL.E, chart from TradingView.com

Bitcoin Price Could Still Crash To $99,000 If This Happens, Warns Ostium Labs

2025/09/23 19:30

Ostium Research’s latest weekly note opened with Bitcoin under pressure after a swift selloff into the new week, describing “a mass liquidation event” that pushed price as low as $111,761, after rejection near resistance in the mid-$117,000s.

The team frames the drawdown as part of a previously flagged “window of weakness… into early October,” while stressing the higher-timeframe uptrend remains intact unless key weekly levels fail. The report, published September 22, 2025, sets out both the technical map and the event calendar that could govern path-dependency over the next several sessions.

Bitcoin Crash To $99,000 Looms

On the weekly chart, Ostium notes last week’s consolidation around the August open and a wick into “key resistance… at $117.5k,” followed by a close marginally below the open. Early-week price action then carried price beneath reclaimed support into the $111k handle, with the analysts highlighting “over $1.6bn in longs liquidated so far today.”
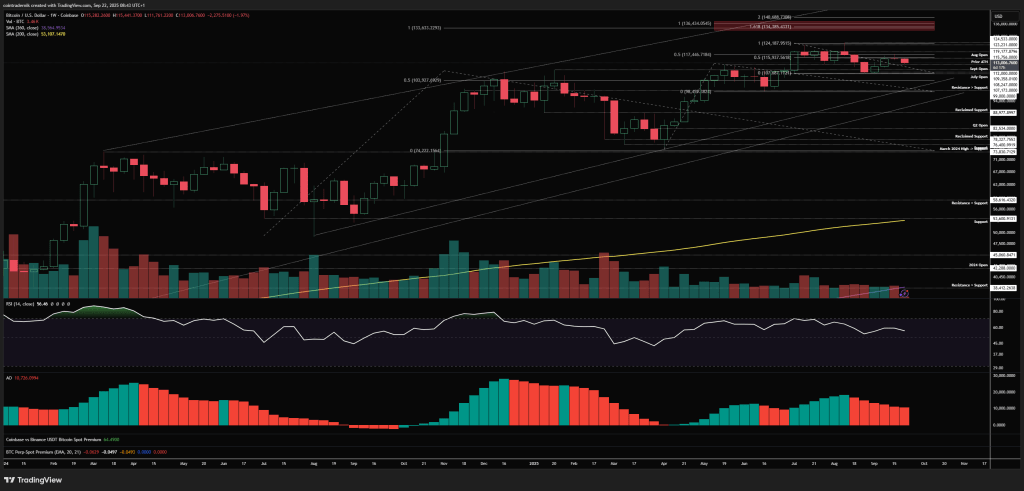
Bitcoin weekly chart

Two structural inflection zones anchor the bearish risk: “Acceptance below $107k on a weekly close would open up more downside into $99k,” whereas on the topside “the weekly high at $115.3k… is at least revisited some time later in the week.”

On the daily timeframe, the August open at $115.7k is the pivot the market must reclaim to reassert momentum. As the authors put it, “that August open at $115.7k [is] a key level to flip into support to resume bullishness.”

The immediate battleground is the prior all-time high at $112k, where “a reclaim of $112k as support” would tilt probabilities toward a higher low and force shorts to cover into a move back through $115.7k. Their base case, however, is for additional chop “between $112k-$115k before a second push lower below today’s low,” which will determine whether the market undercuts the June swing at $107k or marks out a bottom sooner.

Bitcoin daily chart

Tactically, Ostium lays out both long and short triggers with unusual clarity. On the long side: “a sweep of today’s low early this week and then a reclaim of $112k as support,” riding momentum “back into the weekly high.” On the short side, they float what they call “a really nice short setup… a sharp v-reversal… back above the weekly high… before… rejecting and breaking back below $115.3k,” which would then target “$112k and lower.” In other words, a squeeze-then-fade path that punishes both late longs and late shorts.

Positioning and derivatives breadth round out the near-term blueprint. The note shares snapshots of 3-month annualized basis, Bitcoin versus altcoin open interest, and one-week/one-month liquidation maps, underscoring how quickly liquidity pockets can flip into magnets in thin conditions.

This informs their near-term expectation that “the next leg lower or second liquidation event this week [could] be a high probability low,” followed by a retest of $115.3k that will act as the tape’s verdict on whether another down-leg or a bear-trap reversal is in play into quarter-end.

The house view remains probabilistic rather than doctrinaire. If $107k fails on a weekly close, the weakness window could extend into “$99k”; if it holds—and especially if the market can “flip $115.7k into support”—the higher-low narrative stays alive. In the authors’ words, for Ethereum “nothing about this higher timeframe structure or momentum is currently giga-bearish,” and, by analogy, Bitcoin’s structure is best judged by the reaction around $111.7k–$112k this week.

Whether today’s flush proves to be prelude to capitulation or the trap before new highs, Ostium’s bottom line is clear: “we move much higher from early October” unless those weekly thresholds are accepted lower.

At press time, BTC traded at $113,002.

Bitcoin price
Disclaimer: The articles reposted on this site are sourced from public platforms and are provided for informational purposes only. They do not necessarily reflect the views of MEXC. All rights remain with the original authors. If you believe any content infringes on third-party rights, please contact service@support.mexc.com for removal. MEXC makes no guarantees regarding the accuracy, completeness, or timeliness of the content and is not responsible for any actions taken based on the information provided. The content does not constitute financial, legal, or other professional advice, nor should it be considered a recommendation or endorsement by MEXC.
Share Insights

You May Also Like

This U.S. politician’s suspicious stock trade just returned over 200% in weeks

This U.S. politician’s suspicious stock trade just returned over 200% in weeks

The post This U.S. politician’s suspicious stock trade just returned over 200% in weeks appeared on BitcoinEthereumNews.com. United States Representative Cloe Fields has seen his stake in Opendoor Technologies (NASDAQ: OPEN) stock return over 200% in just a matter of weeks. According to congressional trade filings, the lawmaker purchased a stake in the online real estate company on July 21, 2025, investing between $1,001 and $15,000. At the time, the stock was trading around $2 and had been largely stagnant for months. Receive Signals on US Congress Members’ Stock Trades Stocks Stay up-to-date on the trading activity of US Congress members. The signal triggers based on updates from the House disclosure reports, notifying you of their latest stock transactions. Enable signal The trade has since paid off, with Opendoor surging to $10, a gain of nearly 220% in under two months. By comparison, the broader S&P 500 index rose less than 5% during the same period. OPEN one-week stock price chart. Source: Finbold Assuming he invested a minimum of $1,001, the purchase would now be worth about $3,200, while a $15,000 stake would have grown to nearly $48,000, generating profits of roughly $2,200 and $33,000, respectively. OPEN’s stock rally Notably, Opendoor’s rally has been fueled by major corporate shifts and market speculation. For instance, in August, the company named former Shopify COO Kaz Nejatian as CEO, while co-founders Keith Rabois and Eric Wu rejoined the board, moves seen as a return to the company’s early innovative spirit.  Outgoing CEO Carrie Wheeler’s resignation and sale of millions in stock reinforced the sense of a new chapter. Beyond leadership changes, Opendoor’s surge has taken on meme-stock characteristics. In this case, retail investors piled in as shares climbed, while short sellers scrambled to cover, pushing prices higher.  However, the stock is still not without challenges, where its iBuying model is untested at scale, margins are thin, and debt tied to…
Share
BitcoinEthereumNews2025/09/18 04:02