

Bitcoin On-Chain Indicators: CryptoQuant CEO Reveals Crucial Long-Term Trend Accuracy

BitcoinWorld
Bitcoin On-Chain Indicators: CryptoQuant CEO Reveals Crucial Long-Term Trend Accuracy
SEOUL, South Korea – December 2024: Blockchain analytics firm CryptoQuant’s CEO, Ju Ki-young, recently delivered a significant clarification about Bitcoin’s on-chain indicators through a detailed X platform post. His analysis confirms these metrics maintain substantial validity for identifying major market movements, despite their limitations in capturing short-term volatility. This revelation arrives during a period of renewed institutional interest in cryptocurrency markets, providing investors with crucial insights for navigating the complex 2025 landscape.
Understanding Bitcoin On-Chain Indicators
On-chain indicators represent fundamental blockchain data that analysts scrutinize to gauge network health and investor behavior. These metrics derive directly from Bitcoin’s transparent ledger, offering objective insights beyond traditional market sentiment. Key indicators include:
- Network Value to Transactions (NVT) Ratio: Compares market capitalization to transaction volume
- MVRV Z-Score: Measures whether Bitcoin trades above or below its “fair value”
- Exchange Net Flow: Tracks movement between wallets and trading platforms
- Active Addresses: Monitors daily participating users on the network
- Miner Revenue: Observes mining economics and selling pressure
These indicators collectively form a comprehensive picture of Bitcoin’s fundamental strength. They essentially measure the underlying economic activity supporting the cryptocurrency’s value proposition. Consequently, analysts have relied on them for years to identify major market cycles and structural trends.
The Long-Term Predictive Power of Blockchain Data
Ju Ki-young’s analysis specifically highlights the remarkable accuracy of on-chain indicators for forecasting substantial price movements. He notes these metrics successfully predicted Bitcoin’s approximately 600% appreciation during previous bull markets. This predictive power stems from their ability to capture fundamental shifts in network adoption and investor accumulation patterns.
Historical data supports this assertion. For instance, the MVRV Z-Score accurately signaled major market bottoms in 2015, 2018, and 2022. Similarly, exchange outflows consistently preceded significant price rallies throughout Bitcoin’s history. These patterns demonstrate how on-chain metrics reflect genuine economic activity rather than speculative trading noise.
Expert Analysis: Why Long-Term Signals Matter
Financial analysts emphasize the importance of distinguishing between noise and signal in volatile markets. On-chain indicators excel at filtering out short-term market manipulation and emotional trading. They provide institutional investors with the confidence to make substantial allocations during periods of fundamental strength.
Market strategist Dr. Elena Rodriguez explains, “Blockchain data offers unprecedented transparency into asset flows. When whales accumulate during price declines or miners reduce selling pressure, these actions create measurable on-chain signatures. Savvy investors recognize these patterns as reliable long-term signals.”
Short-Term Limitations and Technical Analysis Integration
Despite their long-term accuracy, Ju acknowledges on-chain indicators frequently miss short-term price fluctuations of approximately 30%. This limitation occurs because immediate market movements often respond to news events, liquidity changes, or technical trading patterns that blockchain metrics cannot capture in real-time.
Successful traders therefore combine on-chain fundamentals with technical analysis. This dual approach provides comprehensive market understanding. The table below illustrates this complementary relationship:
| Analysis Type | Time Horizon | Primary Data Source | Best For |
|---|---|---|---|
| On-Chain Analysis | Months to Years | Blockchain Transactions | Identifying Macro Trends |
| Technical Analysis | Days to Weeks | Price Charts & Volume | Timing Entry/Exit Points |
Technical indicators like moving averages, relative strength index, and support/resistance levels help traders navigate short-term volatility. Meanwhile, on-chain metrics provide the fundamental conviction to maintain positions through market turbulence.
The Evolution of Crypto Analytics in 2025
The cryptocurrency analytics field has matured significantly since Bitcoin’s early years. Modern platforms now process petabytes of blockchain data using sophisticated machine learning algorithms. This technological advancement enables more nuanced interpretations of on-chain signals.
CryptoQuant itself has developed numerous proprietary indicators that institutional clients utilize for investment decisions. Their data feeds power trading algorithms at major financial institutions. This institutional adoption validates the practical utility of on-chain analysis for professional market participants.
Furthermore, regulatory developments have increased demand for transparent analytics. As governments implement clearer cryptocurrency frameworks, traditional investors seek objective data sources beyond price charts. On-chain metrics provide this necessary transparency, supporting the market’s ongoing maturation.
Real-World Application: Institutional Adoption Patterns
Recent months have witnessed accelerating institutional Bitcoin adoption, with on-chain metrics providing early signals of this trend. Exchange net flows showed substantial accumulation by known corporate wallets before major price movements. Similarly, the percentage of Bitcoin supply held long-term reached record highs, indicating strong holder conviction.
These patterns demonstrate how on-chain analysis provides actionable intelligence for market participants. Portfolio managers monitor these metrics to gauge overall market health and identify potential regime changes. The data offers objective evidence supporting investment thesis development in an often speculative market.
Conclusion
CryptoQuant CEO Ju Ki-young’s analysis reaffirms the enduring value of Bitcoin on-chain indicators for long-term trend identification. While these metrics may miss short-term volatility, their accuracy in predicting major market movements provides investors with crucial strategic insights. As cryptocurrency markets evolve toward greater institutional participation in 2025, objective blockchain data will increasingly inform investment decisions. Savvy market participants will continue combining on-chain fundamentals with technical analysis for comprehensive market understanding.
FAQs
Q1: What exactly are Bitcoin on-chain indicators?
On-chain indicators are metrics derived directly from Bitcoin’s blockchain data, including transaction volumes, wallet movements, mining activity, and network participation. They provide objective measurements of fundamental network health beyond price movements.
Q2: Why do on-chain indicators miss short-term price movements?
Short-term volatility often results from news events, liquidity changes, or technical trading patterns that don’t immediately register on the blockchain. On-chain metrics better reflect gradual shifts in adoption and accumulation that drive long-term trends.
Q3: How accurate are on-chain indicators for long-term predictions?
Historical data shows on-chain indicators successfully identified Bitcoin’s major bull markets with approximately 600% gains. They reliably signal when the network reaches extreme overvaluation or undervaluation based on fundamental usage metrics.
Q4: Should traders use on-chain analysis alone?
Most experts recommend combining on-chain fundamentals with technical analysis. On-chain data provides long-term directional conviction, while technical analysis helps time entry and exit points within shorter timeframes.
Q5: How has on-chain analysis evolved for institutional investors?
Modern platforms now process massive blockchain datasets using machine learning, creating sophisticated proprietary indicators. Institutional adoption has validated these metrics as crucial tools for investment decision-making in cryptocurrency markets.
This post Bitcoin On-Chain Indicators: CryptoQuant CEO Reveals Crucial Long-Term Trend Accuracy first appeared on BitcoinWorld.
You May Also Like

Three dormant wallets, suspected to belong to the same entity, purchased 5,970 ETH eight hours ago.
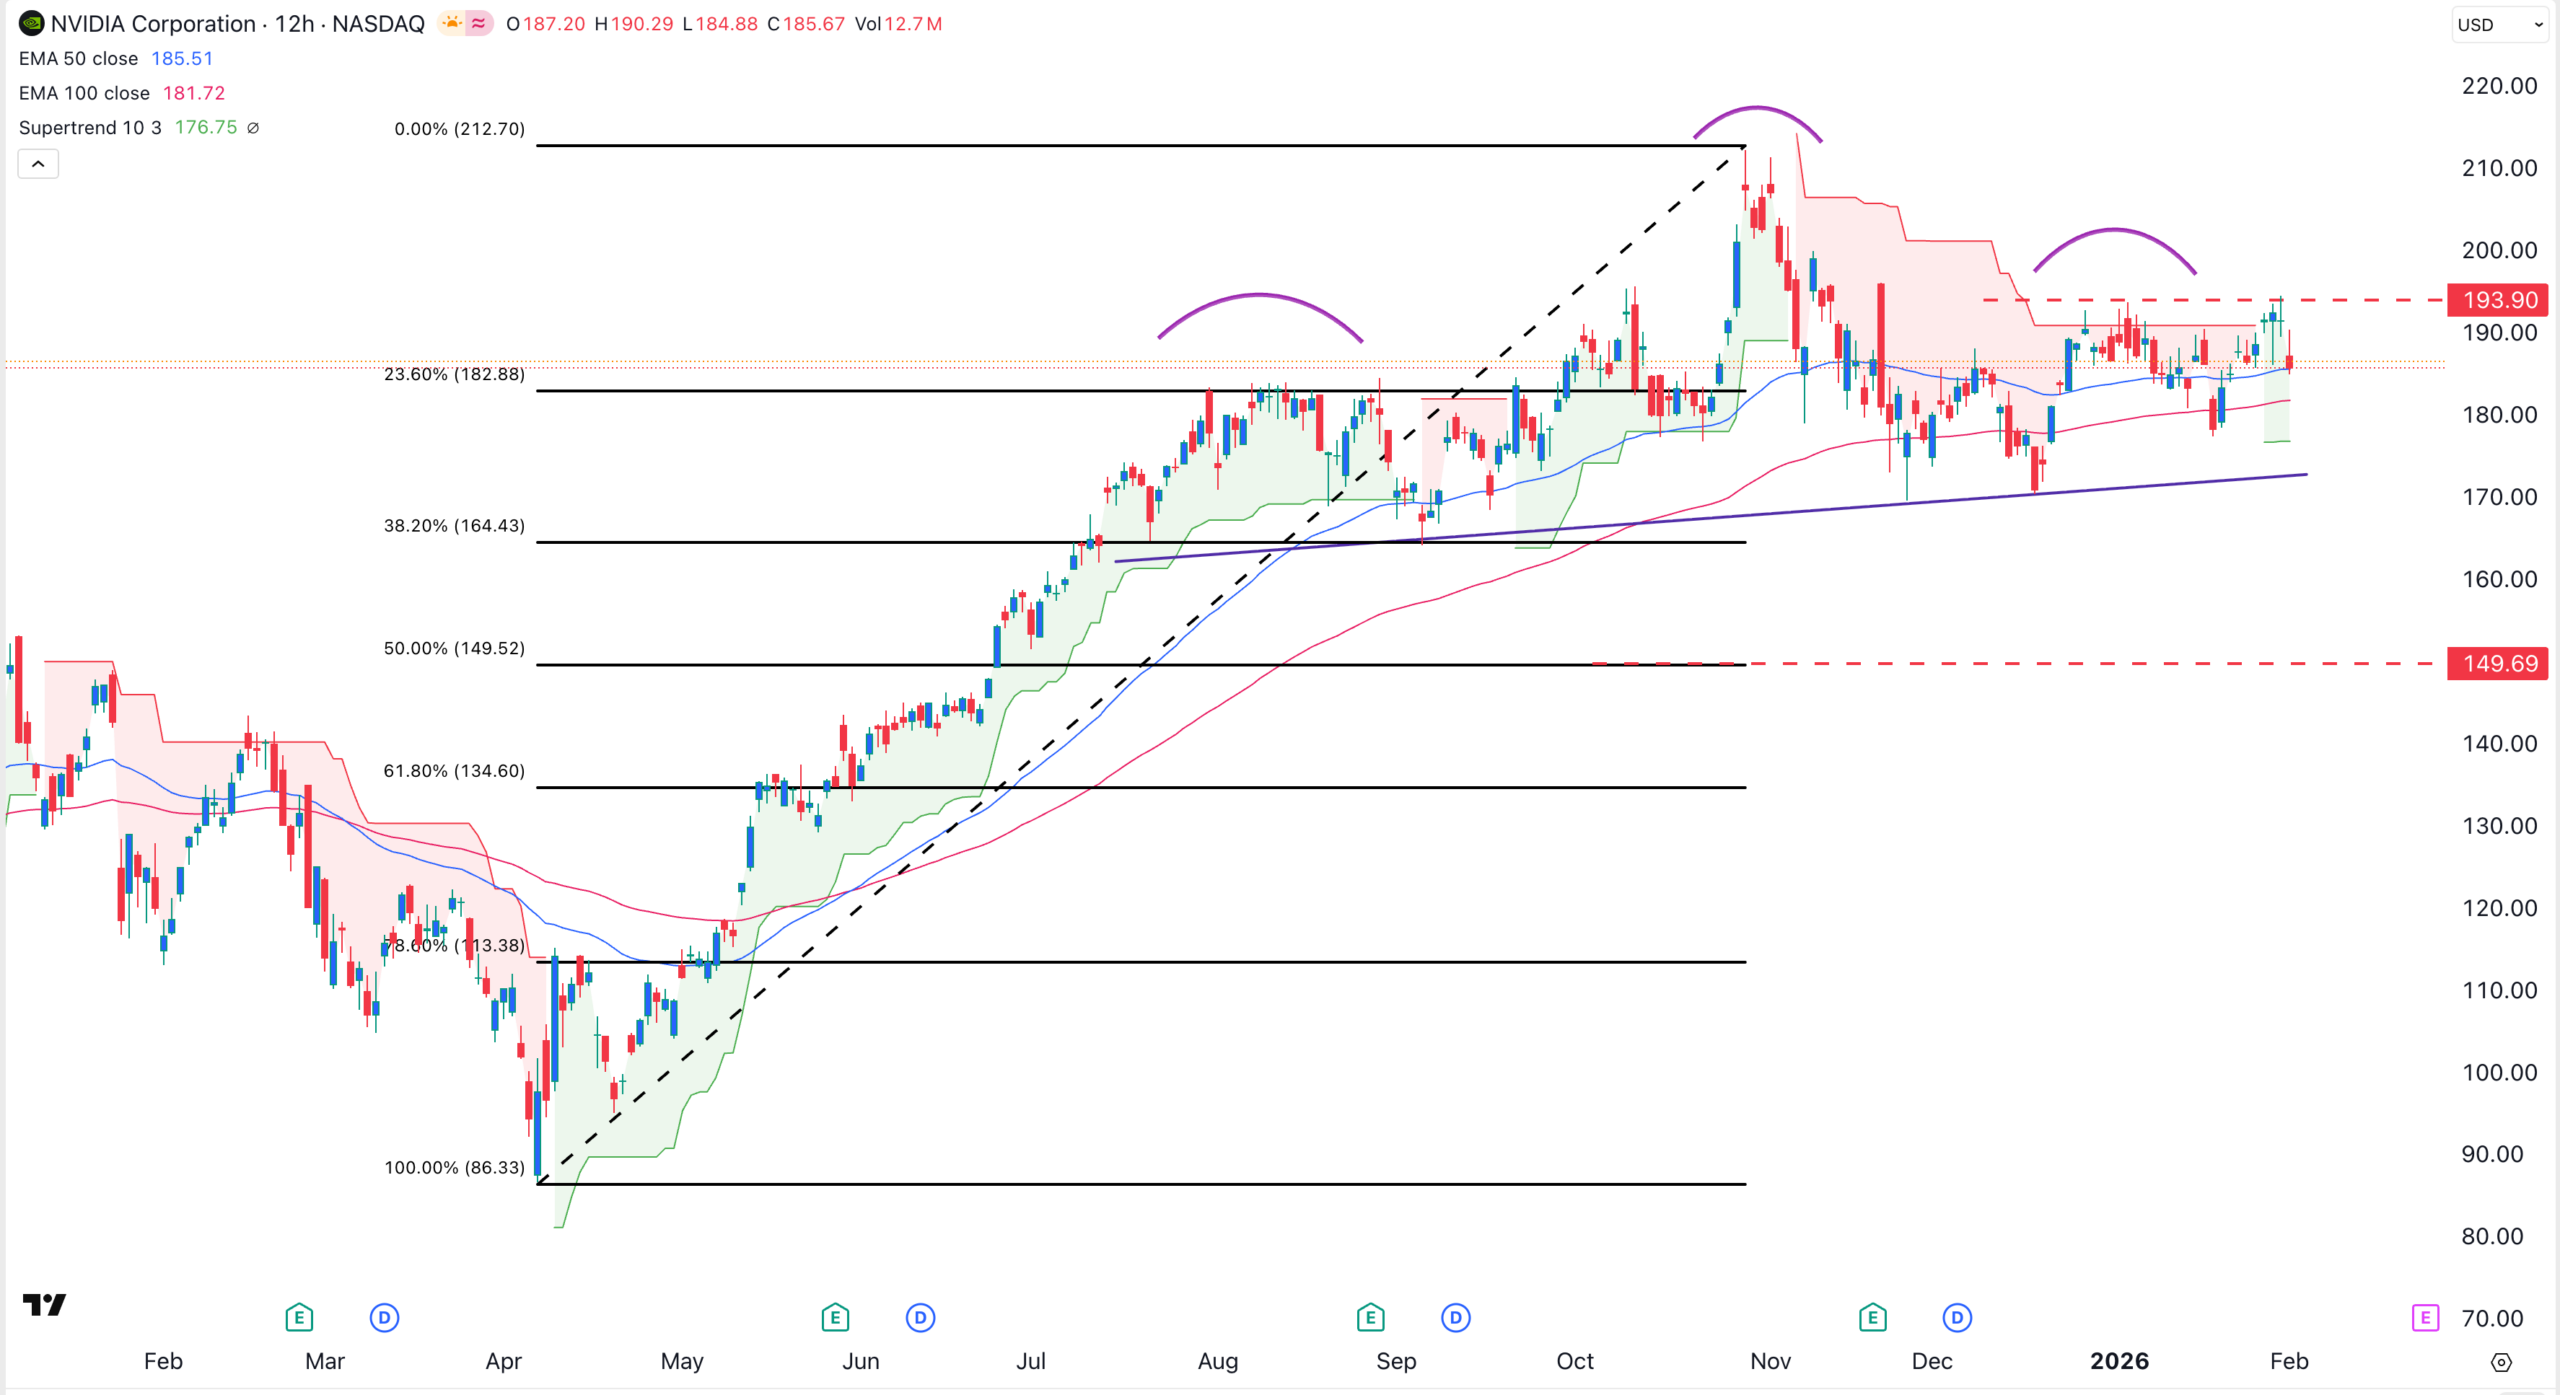
NVIDIA Stock Price Analysis as OpenAI Issues Concerns About its Chips
