

Bitcoin staat onder druk door een combinatie van technische factoren op de hogere tijdframes. Op de BTC weekgrafiek ligt de focus op de 100-weekse EMA, een voortschrijdendBitcoin staat onder druk door een combinatie van technische factoren op de hogere tijdframes. Op de BTC weekgrafiek ligt de focus op de 100-weekse EMA, een voortschrijdend
Daalt de Bitcoin koers richting $75.000 na verzwakking van 0,786 Fibonacci steun?
Bitcoin staat onder druk door een combinatie van technische factoren op de hogere tijdframes. Op de BTC weekgrafiek ligt de focus op de 100-weekse EMA, een voortschrijdend gemiddelde dat vaker wordt gebruikt om lange termijn trends te beoordelen. Tegelijk laat de structuur op de daggrafiek nog steeds lagere toppen zien. Dit wijst erop dat bulls moeite hebben om de controle terug te krijgen. Zakt de Bitcoin koers hierdoor richting $75.000? Check onze Discord Connect met "like-minded" crypto enthousiastelingen Leer gratis de basis van Bitcoin & trading - stap voor stap, zonder voorkennis. Krijg duidelijke uitleg & charts van ervaren analisten. Sluit je aan bij een community die samen groeit. Nu naar Discord Bitcoin koers: wat deze technisch op de korte termijn laat zien Op zowel de daggrafiek als de 4-uurs grafiek beweegt de Bitcoin koers al meerdere weken binnen een dalend prijskanaal. Dit betekent dat elke herstelbeweging lager eindigt dan de vorige. Die structuur wordt vaak gebruikt om de richting van een trend te bepalen. Zolang dit patroon intact blijft, is er technisch gezien geen sprake van een trendomslag. Een belangrijk technisch niveau ligt rond de zogeheten Golden Pocket. Dit is het gebied rond de 0,618 Fibonacci retracement van de vorige stijgende koersbeweging. Fibonacci retracements worden gebruikt om te meten hoe ver een correctie teruggaat binnen een trend. In eerdere BTC marktcycli functioneerde dit niveau vaker als een kantelpunt tussen herstel en verdere daling. De Bitcoin koers probeerde dit gebied eerder opnieuw te bereiken, maar de candles sloten niet overtuigend hierboven. Daarbij nam het handelsvolume af. Lagere volumes bij een poging tot koersstijging laten zien dat er minder actieve koopdruk is. Volgens crypto-analist Shardi B, die met EMA structuren over meerdere Bitcoin cycli werkt, wijst dit op een terughoudende marktdeelname en niet op sterke accumulatie door de bulls. Welke crypto nu kopen?Lees onze uitgebreide gids en leer welke crypto nu kopen verstandig kan zijn! Welke crypto nu kopen? Trump is te midden de handelsoorlogen volop bezig met nieuwe plannen, en binnen die plannen lijken een aantal altcoins een compleet onmisbare rol te gaan spelen. Dit zal dus zorgen voor nieuwe kansen. Maar eén vraag komt telkens terug: welke crypto moet je nu kopen? In dit artikel bespreken we de munten… Continue reading Daalt de Bitcoin koers richting $75.000 na verzwakking van 0,786 Fibonacci steun? document.addEventListener('DOMContentLoaded', function() { var screenWidth = window.innerWidth; var excerpts = document.querySelectorAll('.lees-ook-description'); excerpts.forEach(function(description) { var excerpt = description.getAttribute('data-description'); var wordLimit = screenWidth wordLimit) { var trimmedDescription = excerpt.split(' ').slice(0, wordLimit).join(' ') + '...'; description.textContent = trimmedDescription; } }); }); Afwijzing rond een belangrijk Fibonacci niveau zet druk op de Bitcoin structuur Toen de Bitcoin koers eerder onder de Golden Pocket zakte, veranderde dit niveau van een support naar een weerstand. Dit is een bekend technisch principe. Zodra een steunzone breekt, wordt dit vaak een gebied waar de verkooporders liggen bij een hertest. Dat is precies wat nu bij BTC zichtbaar is. Meerdere candles op de 4-uurs grafiek tonen een afwijzing in dit gebied. De bovenste wicks zijn relatief lang, terwijl de bodies klein blijven. Dit patroon duidt erop dat de bulls de Bitcoin prijs wel omhoog proberen te duwen, maar dat bears toch de controle behouden voordat er een hogere dagsluiting mogelijk is. Het gevolg is dat de BTC markt zich steeds verder samenknijpt richting een lagere steun. Er ontstaat hierdoor geen impuls omhoog, maar ook geen directe koersversnelling omlaag. Zo’n prijsactie wordt vaak gezien in de aanloop naar een grotere koersbeweging, maar alleen als er ook een duidelijke technische trigger volgt. De BTC steunzone rond een lager Fibonacci retracement blijft onder druk Onder de Golden Pocket ligt een volgende belangrijke zone rond de 0,786 Fibonacci retracement. Dit niveau ligt rond de $86.000 en speelde ook in eerdere BTC fases een rol als tijdelijke bodem na correcties. In eerdere markten zorgde dit gebied soms voor consolidatie voordat er een nieuwe trend ontstond. De recente candles laten echter zien dat deze zone meerdere keren wordt getest zonder duidelijke sterke oplevingen. Elke opleving is kleiner dan de vorige. Dit wijst erop dat de koopdruk afneemt. Er is dus geen duidelijke instroom van kapitaal zichtbaar die deze zone verdedigt. Als dit niveau structureel verzwakt, verschuift de aandacht naar een bredere ondersteuningszone lager in de BTC grafiek. Die prijszone ligt rond de $75.000 en komt overeen met eerdere stressmomenten in de Bitcoin markt, waaronder de correctie tijdens veel macro onrust in 2025. Dit niveau wordt gezien als een structureel referentiepunt, niet als een korte termijn prijsdoel. $BTC So far, BTC is moving as expected. As mentioned, BTC moved downward after the fake breakout and nearly touched the 83k-85k zone. Currently, it is facing resistance at the 90k level, which acted as strong support earlier. If the momentum continues, then we may see it at… https://t.co/Y4oWoWDkiC pic.twitter.com/FhSgXVcz2z — Crypto Candy🔥💎 (@cryptocandy24x) January 28, 2026 BTC weekgrafiek en het voortschrijdend gemiddelde blijven leidend Op de BTC weekgrafiek ligt de focus op de 100-weekse EMA rond de $94.000. Een EMA is een voortschrijdend gemiddelde dat meer gewicht geeft aan de recente prijsactie. Hierdoor reageert het sneller dan een simpel gemiddelde. In eerdere Bitcoin cycli fungeerde deze lijn vaak als een zone waar de markt na een correctie stabiliseerde. De Bitcoin koers beweegt momenteel rond dit gemiddelde zonder hier duidelijk afstand van te nemen. Dat betekent dat de BTC markt zich in een neutrale fase bevindt. De Relative Strength Index op weekbasis staat rond de 41,5. Dit ligt onder het middenniveau van 50, wat wijst op een afgenomen momentum, maar nog niet op extreme zwakte. Volgens crypto specialist Shardi B is vooral de wekelijkse sluiting relevant. Pas als de candles structureel boven deze EMA sluiten, kan er gesproken worden van een bevestigde ondersteuning op de lange termijn. Zonder dit signaal blijft de Bitcoin markt technisch kwetsbaar. $BTC We have a whole week to confirm this weekly bottom candle, we do that…after testing the 100 week this many times successfully, I think the bottom is in… we’ll see… Has to close the week over 93.850k pic.twitter.com/Mp03kpregI — Don’t Follow Shardi B If You Hate Money (@ShardiB2) January 28, 2026 Vooruitblik op de Bitcoin koers De essentie van de huidige BTC situatie is technisch van aard. De Bitcoin koers zit klem tussen een belangrijke Fibonacci weerstand en een afnemende steun daaronder. Het dalende kanaal op lagere tijdframes is nog intact. Tegelijkertijd ligt er op de weekgrafiek een lange termijn indicator die eerder stabiliteit bracht, maar nog niet overtuigend wordt bevestigd. Zolang de Bitcoin koers geen duidelijke wekelijkse sluiting boven de 100-weekse EMA laat zien en de Golden Pocket niet met een toenemend BTC volume herwonnen wordt, blijft het technische beeld neutraal tot zwak. De komende structuur zal bepalen of de Bitcoin markt opnieuw balans vindt of verder terugvalt richting lagere historische prijszones. Best wallet - betrouwbare en anonieme wallet Best wallet - betrouwbare en anonieme wallet Meer dan 60 chains beschikbaar voor alle crypto Vroege toegang tot nieuwe projecten Hoge staking belongingen Lage transactiekosten Best wallet review Koop nu via Best Wallet Let op: cryptocurrency is een zeer volatiele en ongereguleerde investering. Doe je eigen onderzoek.
Het bericht Daalt de Bitcoin koers richting $75.000 na verzwakking van 0,786 Fibonacci steun? is geschreven door Dirk van Haaster en verscheen als eerst op Bitcoinmagazine.nl.
Disclaimer: The articles reposted on this site are sourced from public platforms and are provided for informational purposes only. They do not necessarily reflect the views of MEXC. All rights remain with the original authors. If you believe any content infringes on third-party rights, please contact service@support.mexc.com for removal. MEXC makes no guarantees regarding the accuracy, completeness, or timeliness of the content and is not responsible for any actions taken based on the information provided. The content does not constitute financial, legal, or other professional advice, nor should it be considered a recommendation or endorsement by MEXC.
You May Also Like
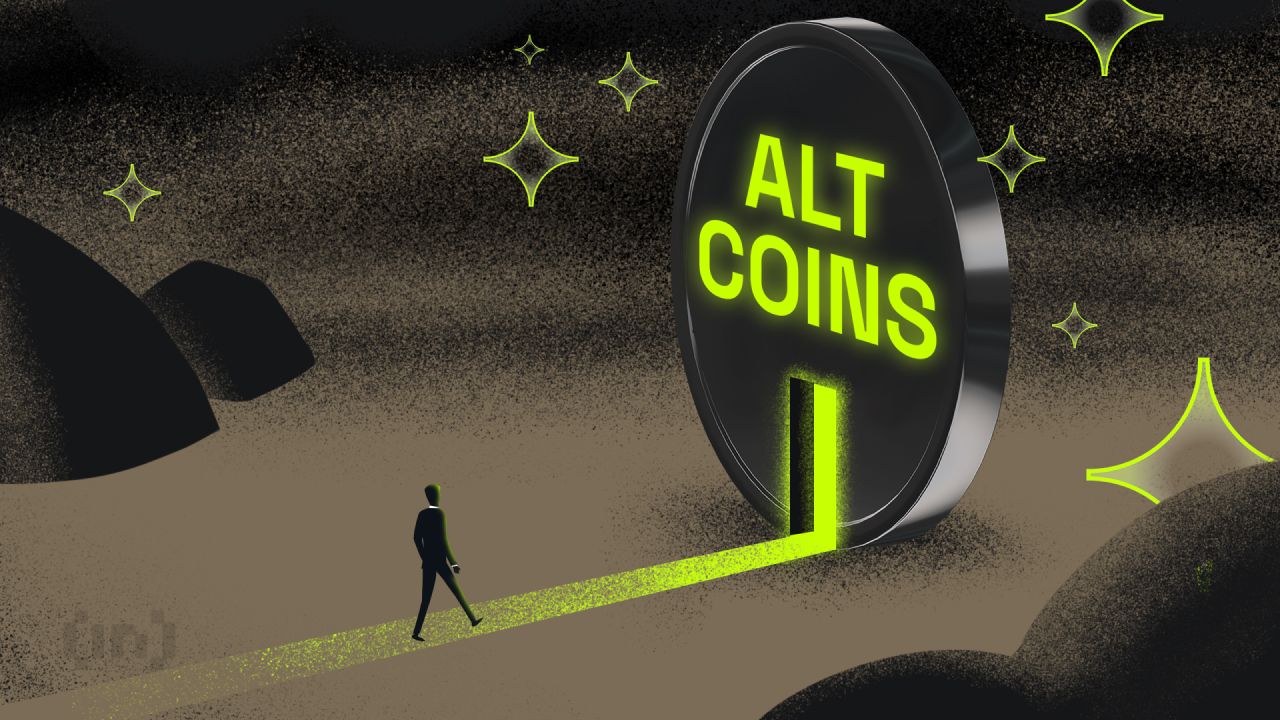
Which Altcoins Stand to Gain from the SEC’s New ETF Listing Standards?
On Wednesday, the US SEC (Securities and Exchange Commission) took a landmark step in crypto regulation, approving generic listing standards for spot crypto ETFs (exchange-traded funds). This new framework eliminates the case-by-case 19b-4 approval process, streamlining the path for multiple digital asset ETFs to enter the market in the coming weeks. Grayscale’s Multi-Crypto Milestone Grayscale secured a first-mover advantage as its Digital Large Cap Fund (GDLC) received approval under the new listing standards. Products that will be traded under the ticker GDLC include Bitcoin, Ethereum, XRP, Solana, and Cardano. “Grayscale Digital Large Cap Fund $GDLC was just approved for trading along with the Generic Listing Standards. The Grayscale team is working expeditiously to bring the FIRST multi-crypto asset ETP to market with Bitcoin, Ethereum, XRP, Solana, and Cardano,” wrote Grayscale CEO Peter Mintzberg. The approval marks the US’s first diversified, multi-crypto ETP, signaling a shift toward broader portfolio products rather than single-asset ETFs. Bloomberg’s Eric Balchunas explained that around 12–15 cryptocurrencies now qualify for spot ETF consideration. However, this is contingent on the altcoins having established futures trading on Coinbase Derivatives for at least six months. This includes well-known altcoins like Dogecoin (DOGE), Litecoin (LTC), and Chainlink (LINK), alongside the majors already included in Grayscale’s GDLC. Altcoins in the Spotlight Amid New Era of ETF Eligibility Several assets have already met the key condition, regulated futures trading on Coinbase. For example, Solana futures launched in February 2024, making the token eligible as of August 19. “The SEC approved generic ETF listing standards. Assets with a regulated futures contract trading for 6 months qualify for a spot ETF. Solana met this criterion on Aug 19, 6 months after SOL futures launched on Coinbase Derivatives,” SolanaFloor indicated. Crypto investors and communities also identified which tokens stand to gain. Chainlink community liaison Zach Rynes highlighted that LINK could soon see its own ETF. He noted that both Bitwise and Grayscale have already filed applications. Meanwhile, the Litecoin Foundation indicated that the new standards provide the regulatory framework for LTC to be listed on US exchanges. Hedera is also in the spotlight, with digital asset investor Mark anticipating an HBAR ETF. Market observers see the decision as a potential turning point for broader adoption, bringing the much-needed clarity and accessibility for investors. At the same time, it boosts confidence in the market’s maturity. The general sentiment is that with the SEC’s approval, the next phase of crypto ETFs is no longer a question of ‘if,’ but ‘when.’ The shift to generic listing standards could expand the US-listed digital asset ETFs roster beyond Bitcoin and Ethereum. Such a move would usher in new investment vehicles covering a dozen or more altcoins. This represents the clearest path yet toward mainstream, regulated access to diversified crypto exposure. More importantly, it comes without the friction of direct custody. “We’re gonna be off to the races in a matter of weeks,” ETF analyst James Seyffart quipped.
Share
Coinstats2025/09/18 12:57

Zhongchi Chefu acquired $1.87 billion worth of digital assets from a crypto giant for $1.1 billion.
PANews reported on February 10th that Autozi Internet Technology (Global) Ltd. (AZI), a US-listed Chinese company, has successfully acquired approximately $1.87
Share
PANews2026/02/10 20:36

XRP news: Ripple expands RLUSD stablecoin use in UAE via Zand Bank
Ripple has expanded the reach of its RLUSD stablecoin in the Middle East through a new strategic partnership with UAE-based digital bank Zand, a move that could
Share
Crypto.news2026/02/10 20:08