Ripple XRP Price: Holds Support as First Weekly ETF Outflows Recorded
TLDR
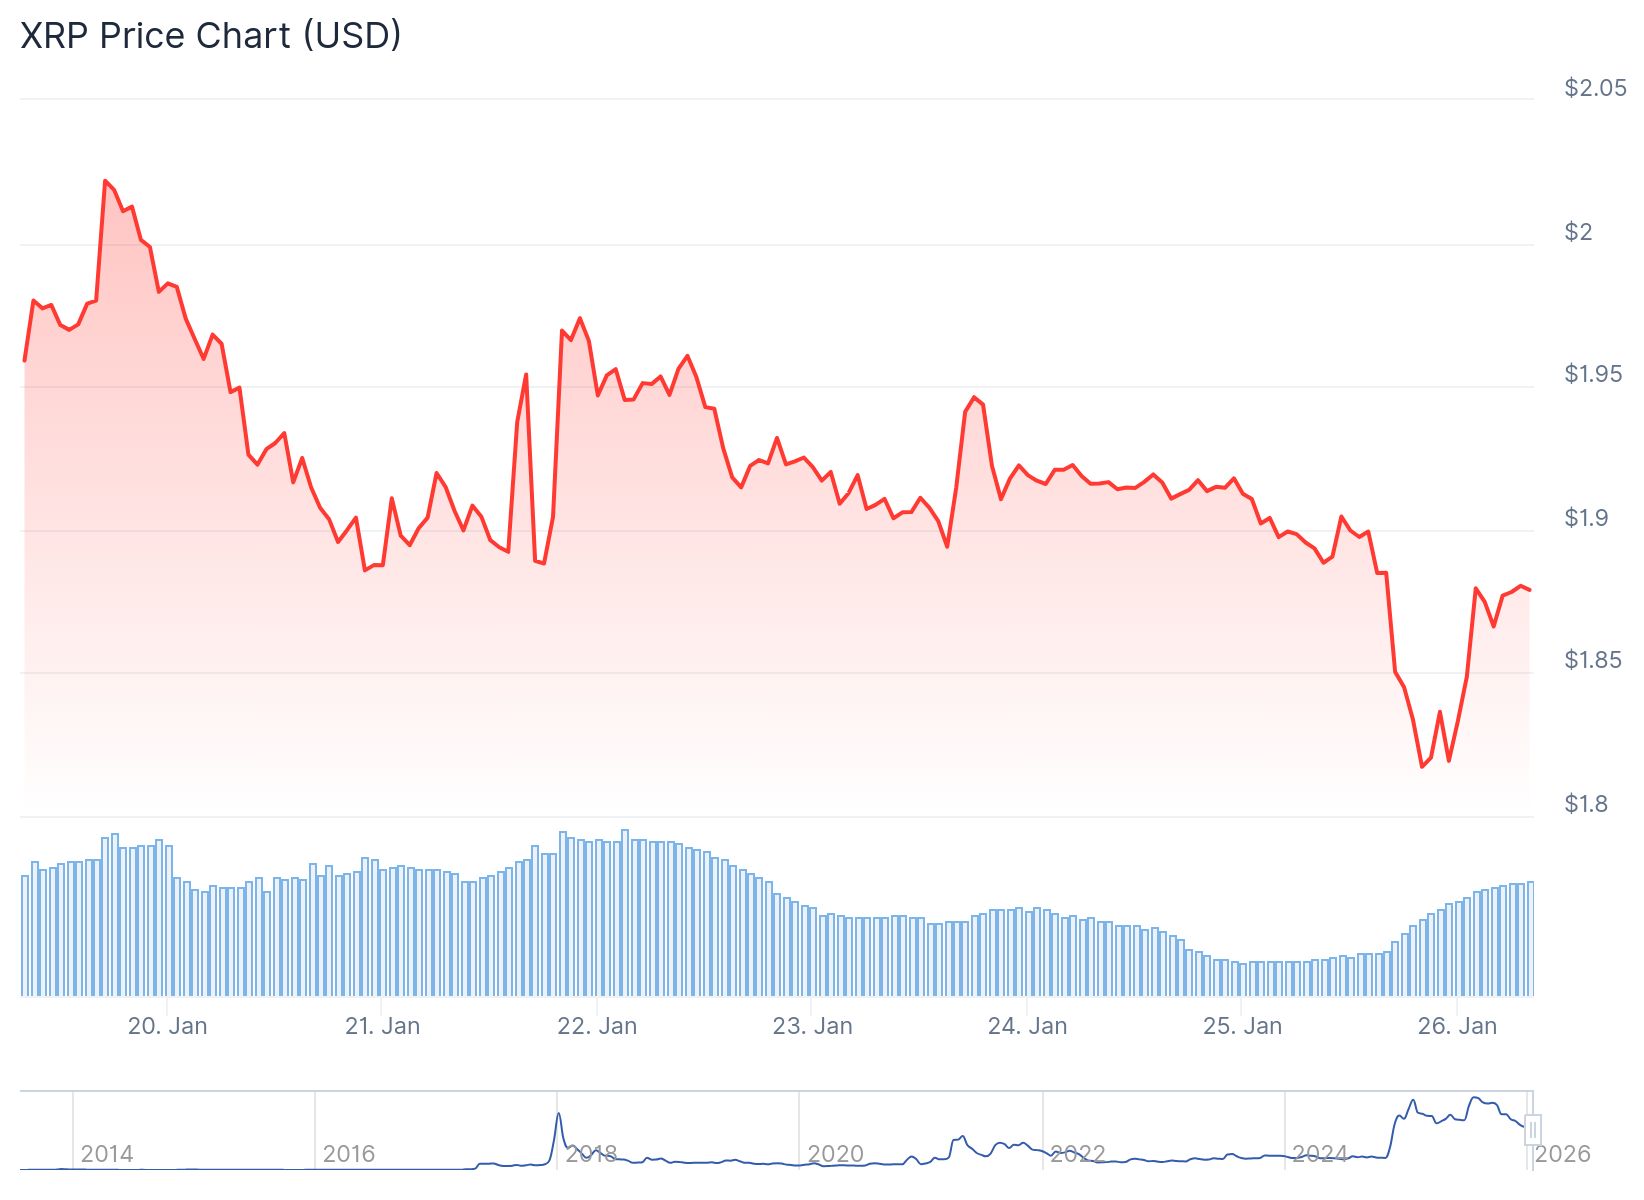
- XRP is trading near $1.89-$1.91 with triple-bottom support holding at $1.88 after dropping below $2.00 this week
- U.S. spot XRP ETFs recorded their first weekly net outflows of approximately $40.6 million in late January
- Trading volume dropped over 50% in 24 hours, showing trader hesitation rather than aggressive selling
- XRP price is trading below key moving averages with resistance at $1.90-$1.95 and support between $1.85-$1.88
- More than 300 financial institutions remain connected to RippleNet as fundamental adoption metrics stay stable
XRP is trading between $1.89 and $1.91 as January comes to a close. The token has held a triple-bottom support level around $1.88 after falling below the $2.00 mark earlier this week.
 XRP Price
The recent pullback has come alongside ETF outflows and a sharp drop in trading volume. However, price action suggests the market is stabilizing rather than experiencing continued selling pressure.
Buyers have repeatedly defended the same demand zone around $1.88. This pattern indicates that XRP is approaching a technical decision point that could determine its next move.
ETF Money Flows Reverse After Strong Start
U.S. spot XRP ETFs recorded their first weekly net outflows in late January, according to data from CryptoQuant. The outflows totaled approximately $40.6 million.
Trading volume has also declined sharply. Some estimates show a drop of more than 50% in 24-hour activity. This decline signals trader hesitation rather than panic selling.
The flow data points to rotation and profit-taking. It does not suggest that investors are abandoning XRP. The token remains one of the few large-cap cryptocurrencies with clear regulatory positioning in the United States.
Earlier ETF inflows exceeded $1 billion. This shows that institutional interest has not disappeared. The current reset appears to be about clearing leverage positions rather than breaking confidence.
Ripple’s core business continues without major changes. XRP still powers on-demand liquidity across Ripple’s global payments network. The system offers faster and cheaper settlement compared to traditional banking systems.
More than 300 financial institutions remain connected to RippleNet. Ongoing regulatory clarity following 2025 court rulings continues to separate XRP from many competing tokens.
No major partnership announcements emerged this week. However, the absence of negative news reinforces the view that current weakness is market-driven rather than fundamental.
Technical Picture Shows Compression
XRP price is stabilizing inside a descending channel on shorter timeframes. A falling trendline near $1.95 is capping upward movement.
The token is trading below the 50-period and 100-period exponential moving averages. The 200-period exponential moving average near $1.99 continues to act as firm resistance.
Support is clearly defined between $1.88 and $1.85. Repeated long lower wicks on the chart suggest buyers are responding at these levels. The Relative Strength Index has recovered into the mid-40s after reaching oversold readings. This indicates that downside pressure is easing.
Volatility has contracted and formed a descending wedge. This structure often resolves with an upward move if support holds.
A break above $1.95 would expose resistance levels at $2.03 to $2.06. This would signal that the structure is repairing. A loss of support below $1.85 would open downside targets toward $1.80 and $1.77.
The first major resistance sits near $1.90. A close above this level could push the price toward $1.95. Further resistance appears at $2.00 and $2.05.
Initial support on the downside is near $1.84. The next major support level is near $1.82. A close below $1.82 could lead to further declines toward $1.78 and $1.75.
The post Ripple XRP Price: Holds Support as First Weekly ETF Outflows Recorded appeared first on CoinCentral.
You May Also Like

Why Bitcoin Fell 53% in 120 Days Without Any Major Bad News
Trump Ignites Speculation with National Bitcoin Venture