XRP price has spent months moving sideways and lower, testing patience without offering clear direction. That slow grind explains why one technical level now carriesXRP price has spent months moving sideways and lower, testing patience without offering clear direction. That slow grind explains why one technical level now carries

XRP Price Is Stuck for One Reason and This Chart Finally Shows It

3 min read

XRP price has spent months moving sideways and lower, testing patience without offering clear direction. That slow grind explains why one technical level now carries so much weight. According to analysis shared by TheCryptoBasic and highlighted by market analyst Chart Nerd, the next move for XRP price does not require complex indicators or bold assumptions. A clean break above a long standing resistance line could be enough to shift momentum.

That resistance has shaped Ripple price behavior since mid 2025, and Chart Nerd believes the market keeps circling the same answer.

XRP Price Faces A Defining Test Against Long Standing Resistance

Chart Nerd’s analysis focuses on a descending trendline that has capped XRP price since July 2025. Every recovery attempt has stalled once price touched that line, turning optimism into another pullback. Current chart data places that resistance around $2.1, a level that now acts as the gateway for any meaningful trend change.
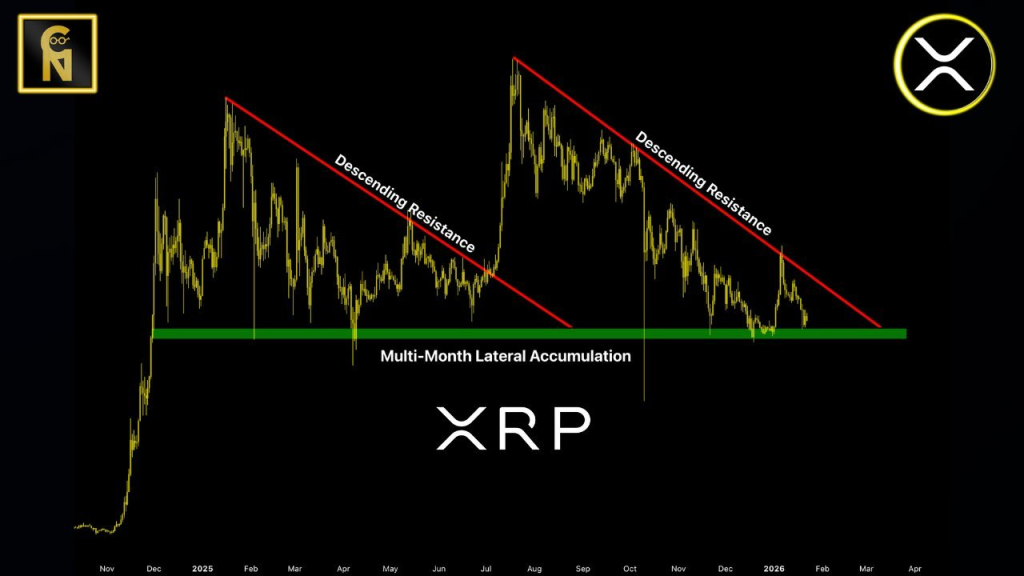
@thecryptobasic / X

XRP price currently trades near $1.91 after another failed recovery attempt earlier in January 2026. Chart Nerd argues that price action remains trapped until that trendline gives way. Sideways movement and short term volatility mean little without a decisive close above resistance.

Ripple Price History Shows Why This Level Matters

Earlier cycles show how powerful this pattern can be. Chart Nerd pointed out that before the recent downtrend, XRP price spent much of early 2024 consolidating around $0.50. Support held between $0.45 and $0.55, creating a base that later fueled a sharp rally.

That rally accelerated after the U.S. election. XRP price surged more than 500% between November 2024 and January 2025, climbing from $0.50 to $3.4. During that period, Ripple price built a strong accumulation zone between $1.7 and $1.9. Sellers regained control after the peak, and the first major resistance trendline emerged.

Failed Breakouts Continue To Shape XRP Price Direction

Several breakout attempts followed. March saw XRP price rebound above $3.02 after XRP was included in a U.S. crypto stockpile announcement. Resistance near $3 stopped that move, sending price down to $1.6 by April 2025. Another recovery in May reached $2.65 before meeting the same fate.

Chart Nerd noted that XRP price briefly broke above resistance in early July, which triggered a fresh uptrend. That move carried Ripple price to around $3.6 by July 18 before another pullback formed the current resistance trendline.

Two more attempts failed under that line. One peaked near $3.1 in October before a market wide crash pushed XRP price to $2.2. Another rally reached $2.41 on January 6, 2026, followed by another rejection.

Read Also: SUI Price Is Reaching a Point That Can’t Be Ignored After Weeks Of Decline

Chart Nerd insists the solution remains straightforward. XRP price needs a decisive close above the descending trendline near $2.1. Until that happens, price action stays range bound as long as the multi month accumulation support remains intact.

Subscribe to our YouTube channel for daily crypto updates, market insights, and expert analysis.

The post XRP Price Is Stuck for One Reason and This Chart Finally Shows It appeared first on CaptainAltcoin.

Disclaimer: The articles reposted on this site are sourced from public platforms and are provided for informational purposes only. They do not necessarily reflect the views of MEXC. All rights remain with the original authors. If you believe any content infringes on third-party rights, please contact service@support.mexc.com for removal. MEXC makes no guarantees regarding the accuracy, completeness, or timeliness of the content and is not responsible for any actions taken based on the information provided. The content does not constitute financial, legal, or other professional advice, nor should it be considered a recommendation or endorsement by MEXC.

You May Also Like

GCC and India to sign terms for start of free trade talks

GCC and India to sign terms for start of free trade talks

The Gulf Cooperation Council (GCC) and India reportedly will sign terms of reference on Thursday to resume talks aimed at finalising a free trade agreement.  Indian
Share
Agbi2026/02/05 13:45
PEPE Holders Looking For The Next 100x Crypto Set Their Sights On Layer Brett Presale

PEPE Holders Looking For The Next 100x Crypto Set Their Sights On Layer Brett Presale

The post PEPE Holders Looking For The Next 100x Crypto Set Their Sights On Layer Brett Presale appeared on BitcoinEthereumNews.com. Crypto News 18 September 2025 | 01:13 The Shiba Inu price prediction has regained investor attention this month as meme coin traders shift strategies ahead of Q4. While SHIB and PEPE continue to dominate headlines, many early holders are now hunting for the next breakout. Layer Brett (LBRETT), a new Ethereum Layer 2 meme coin, is quickly emerging as a top contender. Shiba Inu price prediction: Ecosystem grows but limited short-term upside Shiba Inu (SHIB) is currently priced at $0.00001307, showing slow but steady performance this September. Despite the relatively quiet price action, SHIB’s long-term vision is continuing to take shape. With the rollout of Shibarium, its Layer 2 network, Shiba Inu is transitioning from meme coin status to ecosystem coin. That said, analysts believe that short-term price action remains capped unless broader meme coin interest returns in full force. Resistance levels near $0.000015 remain tough to crack without major catalysts or a spike in retail enthusiasm. For now, Shiba Inu price predictions remain cautious, with most calling for gradual moves higher rather than a sudden breakout. Still, SHIB’s loyal community and expanding ecosystem keep it on the radar for long-term holders, especially those betting on its metaverse and DeFi ambitions to mature into stronger use cases by 2025. PEPE struggles to reclaim momentum after early hype PEPE exploded onto the meme coin scene in 2023 and gained massive traction with retail investors. However, the token’s parabolic rise was followed by a sharp correction. Currently priced around $0.00001087, PEPE still maintains a large following, but the lack of clear development or new utilities has left holders searching for alternatives with more potential. With many early PEPE investors now down from peak levels, attention has shifted to lower-cap meme coins that offer actual utility and early entry benefits. While PEPE may…
Share
BitcoinEthereumNews2025/09/18 07:02
Morning brief: Asian stocks slump as AI capex fears grow, silver plunges

Morning brief: Asian stocks slump as AI capex fears grow, silver plunges

Asian markets retreated on Thursday as investors rotated out of technology stocks amid mounting concerns over the escalating cost of artificial intelligence investment
Share
Coinstats2026/02/05 13:56