

Immutable (IMX) Price Prediction 2026, 2027-2030
- Bullish IMX price prediction for 2026 is $0.570 to $0.965.
- Immutable (IMX) price might reach $4 soon.
- Bearish IMX price prediction for 2026 is $0.219.
In this Immutable (IMX) price prediction 2026, 2027-2030, we will analyze the price patterns of IMX by using accurate trader-friendly technical analysis indicators and predict the future movement of the cryptocurrency.
|
TABLE OF CONTENTS
|
|
INTRODUCTION
|
|
|
IMMUTABLE (IMX) PRICE PREDICTION 2026
|
|
| IMMUTABLE (IMX) PRICE PREDICTION 2027, 2028-2030 |
| CONCLUSION |
| FAQ |
Immutable (IMX) Current Market Status
| Current Price | $0.2537 |
| 24 – Hour Price Change | 2.14% Down |
| 24 – Hour Trading Volume | $26.18M |
| Market Cap | $504.62M |
| Circulating Supply | 1.98B IMX |
| All – Time High | $9.50 (On Nov 26, 2021) |
| All – Time Low | $0.3781 (On Dec 31, 2022) (CoinGecko) |
What is Immutable (IMX)
| TICKER | IMX |
| BLOCKCHAIN | Ethereum Blockchain |
| CATEGORY | Layer-2 scaling solution |
| LAUNCHED ON | November 2021 |
| UTILITIES | Governance, tipping system, gas fees & rewards |
Immutable X is a layer-2 scaling solution for NFTs on Ethereum. It was created to improve Ethereum’s scalability and user experience. IMX is the native token of Immutable X. It was used to pay for transaction fees and incentivize users and developers on the platform.
Immutable X was founded in 2018 by James Ferguson, Robbie Ferguson, and Alex Connolly. The platform provides game developers and all NFT creators with unmatched throughput at zero gas rates for trading and mining NFTs in a carbon-neutral environment.
Immutable 24H Technicals
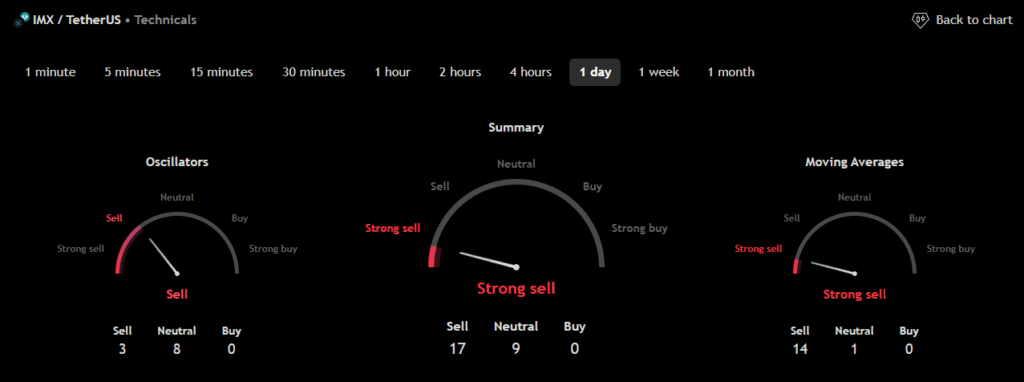 (Source: TradingView)
Immutable (IMX) Price Prediction 2026
Immutable (IMX) ranks 89th on CoinMarketCap in terms of its market capitalization. The overview of the Immutable price prediction for 2026 is explained below with a daily time frame.
In the above chart, Immutable (IMX) laid out a Descending Channel pattern. A descending channel, also known as a falling channel, is a bearish technical analysis pattern formed by two parallel downward-sloping trendlines. The upper trendline connects a series of high points, indicating resistance where the price struggles to rise above, while the lower trendline connects the lower points, acting as support.
This pattern suggests that sellers are in control, with the price consistently making lower highs and lower lows. Traders often look to sell near the upper trendline and buy near the lower trendline, as the price typically oscillates within this defined range. Overall, the descending channel helps traders identify potential shorting opportunities and assess market sentiment.
At the time of analysis, the price of Immutable (IMX) was recorded at $0.2537. If the pattern trend continues, then the price of IMX might reach the resistance levels of $0.386, $0.438, and $0.482. If the trend reverses, then the price of IMX may fall to the support level of $0.356.
Immutable (IMX) Resistance and Support Levels
The chart given below elucidates the possible resistance and support levels of Immutable (IMX) in 2026.
From the above chart, we can analyze and identify the following as resistance and support levels of Immutable (IMX) for 2026.
| Resistance Level 1 | $0.570 |
| Resistance Level 2 | $0.965 |
| Support Level 1 | $0.354 |
| Support Level 2 | $0.219 |
Immutable (IMX) Price Prediction 2026 — RVOL, MA, and RSI
The technical analysis indicators such as Relative Volume (RVOL), Moving Average (MA), and Relative Strength Index (RSI) of Immutable (IMX), are shown in the chart below.
From the readings on the chart above, we can make the following inferences regarding the current Immutable (IMX) market in 2026.
| INDICATOR | PURPOSE | READING | INFERENCE |
| 50-Day Moving Average (50MA) | Nature of the current trend by comparing the average price over 50 days | 50 MA = $0.537 Price = $0.378 (50MA > Price) | Bearish/Downtrend |
| Relative Strength Index (RSI) | Magnitude of price change;Analyzing oversold & overbought conditions | 35.968 <30 = Oversold 50-70 = Neutral >70 = Overbought | Oversold |
| Relative Volume (RVOL) | Asset’s trading volume in relation to its recent average volumes | Below cutoff line | Weak volume |
Immutable (IMX) Price Prediction 2026 — ADX, RVI
In the below chart, we analyze the strength and volatility of Immutable (IMX) using the following technical analysis indicators — Average Directional Index (ADX) and Relative Volatility Index (RVI).
From the readings on the chart above, we can make the following inferences regarding the price momentum of Immutable (IMX).
| INDICATOR | PURPOSE | READING | INFERENCE |
| Average Directional Index (ADX) | Strength of the trend momentum | 23.974 | Weak Trend |
| Relative Volatility Index (RVI) | Volatility over a specific period | 45.26 <50 = Low >50 = High | Low Volatility |
Comparison of IMX with BTC, ETH
Let us now compare the price movements of Immutable (IMX) with those of Bitcoin (BTC) and Ethereum (ETH).
From the above chart, we can interpret that the price action of IMX is similar to that of BTC and ETH. That is, when the price of BTC and ETH increases or decreases, the price of IMX also increases or decreases respectively.
Immutable (IMX) Price Prediction 2027, 2028 – 2030
With the help of the aforementioned technical analysis indicators and trend patterns, let us predict the price of Immutable (IMX) between 2027, 2028, 2029, and 2030.
| Year | Bullish Price | Bearish Price |
| Immutable (IMX) Price Prediction 2027 | $4.5 | $0.1 |
| Immutable (IMX) Price Prediction 2028 | $5 | $0.09 |
| Immutable (IMX) Price Prediction 2029 | $5.5 | $0.08 |
| Immutable (IMX) Price Prediction 2030 | $6 | $0.07 |
Conclusion
If Immutable (IMX) establishes itself as a good investment in 2026, this year would be favorable to the cryptocurrency. In conclusion, the bullish Immutable (IMX) price prediction for 2026 is $0.965. Comparatively, if unfavorable sentiment is triggered, the bearish Immutable (IMX) price prediction for 2026 is $0.219.
If the market momentum and investors’ sentiment positively elevate, then Immutable (IMX) might hit $4. Furthermore, with future upgrades and advancements in the Immutable ecosystem, IMX might surpass its current all-time high (ATH) of $9.50 and mark its new ATH.
FAQ
1. What is Immutable (IMX)?
Immutable X is a layer-2 scaling solution for NFTs on Ethereum. It was created to improve Ethereum’s scalability and user experience.
2. Where can you purchase Immutable (IMX)?
Traders can trade Immutable (IMX) on the following cryptocurrency exchanges such as OKEx, Huobi Global, Bybit, and Bitget.
3. Will Immutable (IMX) reach a new ATH soon?
With the ongoing developments and upgrades within the Immutable platform, Immutable (IMX) has a high possibility of reaching its ATH soon.
4. What is the current all-time high (ATH) of Immutable (IMX)?
Immutable (IMX) hit its current all-time high (ATH) of $9.50 on Nov 26, 2021.
5. What is the lowest price of Immutable (IMX)?
According to CoinMarketCap, IMX hit its all-time low (ATL) of $0.3781 on Dec 31, 2022.
6. Will Immutable (IMX) reach $4?
If Immutable (IMX) becomes one of the active cryptocurrencies that majorly maintain a bullish trend, it might rally to hit $4 soon.
7. What will be Immutable (IMX) price by 2027?
Immutable (IMX) price is expected to reach $4.5 by 2027.
8. What will be Immutable (IMX) price by 2028?
Immutable (IMX) price is expected to reach $5 by 2028.
9. What will be Immutable (IMX) price by 2029?
Immutable (IMX) price is expected to reach $5.5 by 2029.
10. What will be Immutable (IMX) price by 2030?
Immutable (IMX) price is expected to reach $6 by 2030.
Top Crypto Predictions
Popcat (SOL) POPCAT Price Prediction
Kaspa (KAS) Price Prediction
Alchemy Pay (ACH) Price Prediction
Disclaimer: The opinion expressed in this article is solely the author’s. It does not represent any investment advice. TheNewsCrypto team encourages all to do their own research before investing.
You May Also Like

Wormhole’s W token enters ‘value accrual’ phase with strategic reserve

Wall Street sets AMD stock price target for next 12 months
