The post LUNC Price Flashes Early Signs of a Macro Bottom—Is a 288% Technical Reversal Possible? appeared first on Coinpedia Fintech News LUNC price has quietlyThe post LUNC Price Flashes Early Signs of a Macro Bottom—Is a 288% Technical Reversal Possible? appeared first on Coinpedia Fintech News LUNC price has quietly

LUNC Price Flashes Early Signs of a Macro Bottom—Is a 288% Technical Reversal Possible?

2025/12/11 21:58
3 min read
Why Terra Luna Price Is Up Today

The post LUNC Price Flashes Early Signs of a Macro Bottom—Is a 288% Technical Reversal Possible? appeared first on Coinpedia Fintech News

LUNC price has quietly put together an unexpected bounce over the past week, climbing from around $0.000026 to above $0.00008 — roughly a 150% move that stands out after months of heavy selling. The shift comes as downside pressure finally appears to be easing, with LUNA and USTC also seeing speculative inflows that have revived interest across the Terra ecosystem. 

The fundamentals remain shaky, but the recent price behaviour suggests the market may be stabilising after a long period of exhaustion—and this sets the stage for a deeper look at whether a true higher-timeframe reversal is forming.

Early Bullish Intent and Conditions for MSS Confirmation

LUNC is showing its first signs of bullish displacement, hinting at a possible shift in order flow. However, these signals remain preliminary and require validation. The key trigger is a monthly close above the Market Structure Shift (MSS) level at $0.00007300. A confirmed MSS would establish a higher-timeframe trend reversal, unlock bullish Points of Interest (POIs), and open continuation setups through Breaker Blocks, Order Blocks, or Fair Value Gaps. 

Only after this confirmation can price realistically pull toward buyside liquidity at $0.00017980 and the larger draw at $0.00028000 — a potential 288% expansion.

Technical Analysis: Structure, Levels, and Liquidity Zone

LUNC has broken out of a long-standing falling wedge on the weekly timeframe — its first meaningful structural break in months. The breakout was supported by a sharp surge in volume, indicating genuine market participation rather than a thin liquidity spike. Price has also reclaimed the 50-week moving average, a level it consistently struggled with throughout mid-2024 and 2025, which now acts as short-term support.

lunc price

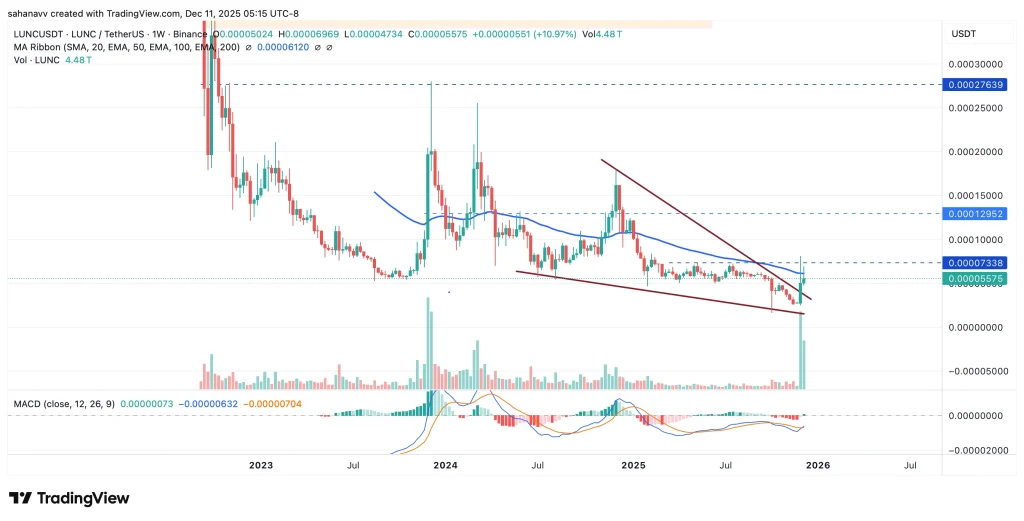
The next major hurdle sits at $0.00007338, a key HTF level that price has tapped but not closed above. Clearing this zone would shift the weekly market structure and validate the broader reversal narrative. Above that, the next liquidity magnet is the $0.00012952 level, followed by the larger liquidity draw at $0.00027639.

Momentum indicators are improving as well: the MACD is crossing upward from deeply negative territory, suggesting the downtrend may finally be losing strength. While these signals are constructive, the lack of strong fundamentals means any upside continuation relies heavily on sustained volume and confirmation through higher closes.

Conclusion-What’s Next for LUNC Price?

LUNC is displaying its strongest macro-reversal signals in years, but technicals alone cannot override weak fundamentals and inconsistent demand. A monthly close above $0.00007300 is essential to confirm a legitimate Market Structure Shift; without it, any bounce remains vulnerable to rejection and renewed downside. If MSS validates, a controlled move toward liquidity zones at $0.00017980 and $0.00028000 becomes feasible. 

However, failure to reclaim MSS places LUNC at risk of prolonged sideways accumulation or deeper retests of lower support. Traders should view this as a technically promising setup, not a guaranteed reversal.

Market Opportunity
Terra Classic Logo
Terra Classic Price(LUNC)
$0.00003687
$0.00003687$0.00003687
+0.46%
USD
Terra Classic (LUNC) Live Price Chart
Disclaimer: The articles reposted on this site are sourced from public platforms and are provided for informational purposes only. They do not necessarily reflect the views of MEXC. All rights remain with the original authors. If you believe any content infringes on third-party rights, please contact service@support.mexc.com for removal. MEXC makes no guarantees regarding the accuracy, completeness, or timeliness of the content and is not responsible for any actions taken based on the information provided. The content does not constitute financial, legal, or other professional advice, nor should it be considered a recommendation or endorsement by MEXC.

You May Also Like

Santander’s Openbank Sparks Crypto Frenzy in Germany

Santander’s Openbank Sparks Crypto Frenzy in Germany

 In Germany, the digital bank Santander Openbank introduces trading in crypto, which offers BTC, ETH, LTC, POL, and ADA in the MiCA framework of the EU. Santander, the largest bank in Spain, has officially introduced cryptocurrency trading to its clients in Germany, using its digital division, Openbank.  With this new service, users can purchase, sell, […] The post Santander’s Openbank Sparks Crypto Frenzy in Germany appeared first on Live Bitcoin News.
Share
LiveBitcoinNews2025/09/18 04:30
The Quantum Leap: Preparing for the Next Era of Computational Power

The Quantum Leap: Preparing for the Next Era of Computational Power

While Artificial Intelligence dominated the headlines of the early 2020s, a more fundamental revolution was brewing in the world of Technology: Quantum Computing
Share
Techbullion2026/02/21 05:48
3 Paradoxes of Altcoin Season in September

3 Paradoxes of Altcoin Season in September

The post 3 Paradoxes of Altcoin Season in September appeared on BitcoinEthereumNews.com. Analyses and data indicate that the crypto market is experiencing its most active altcoin season since early 2025, with many altcoins outperforming Bitcoin. However, behind this excitement lies a paradox. Most retail investors remain uneasy as their portfolios show little to no profit. This article outlines the main reasons behind this situation. Altcoin Market Cap Rises but Dominance Shrinks Sponsored TradingView data shows that the TOTAL3 market cap (excluding BTC and ETH) reached a new high of over $1.1 trillion in September. Yet the share of OTHERS (excluding the top 10) has declined since 2022, now standing at just 8%. OTHERS Dominance And TOTAL3 Capitalization. Source: TradingView. In past cycles, such as 2017 and 2021, TOTAL3 and OTHERS.D rose together. That trend reflected capital flowing not only into large-cap altcoins but also into mid-cap and low-cap ones. The current divergence shows that capital is concentrated in stablecoins and a handful of top-10 altcoins such as SOL, XRP, BNB, DOG, HYPE, and LINK. Smaller altcoins receive far less liquidity, making it hard for their prices to return to levels where investors previously bought. This creates a situation where only a few win while most face losses. Retail investors also tend to diversify across many coins instead of adding size to top altcoins. That explains why many portfolios remain stagnant despite a broader market rally. Sponsored “Position sizing is everything. Many people hold 25–30 tokens at once. A 100x on a token that makes up only 1% of your portfolio won’t meaningfully change your life. It’s better to make a few high-conviction bets than to overdiversify,” analyst The DeFi Investor said. Altcoin Index Surges but Investor Sentiment Remains Cautious The Altcoin Season Index from Blockchain Center now stands at 80 points. This indicates that over 80% of the top 50 altcoins outperformed…
Share
BitcoinEthereumNews2025/09/18 01:43