Crypto Fear & Greed Index: Market Sentiment Stuck at 29 in Fear Zone
BitcoinWorld
Crypto Fear & Greed Index: Market Sentiment Stuck at 29 in Fear Zone
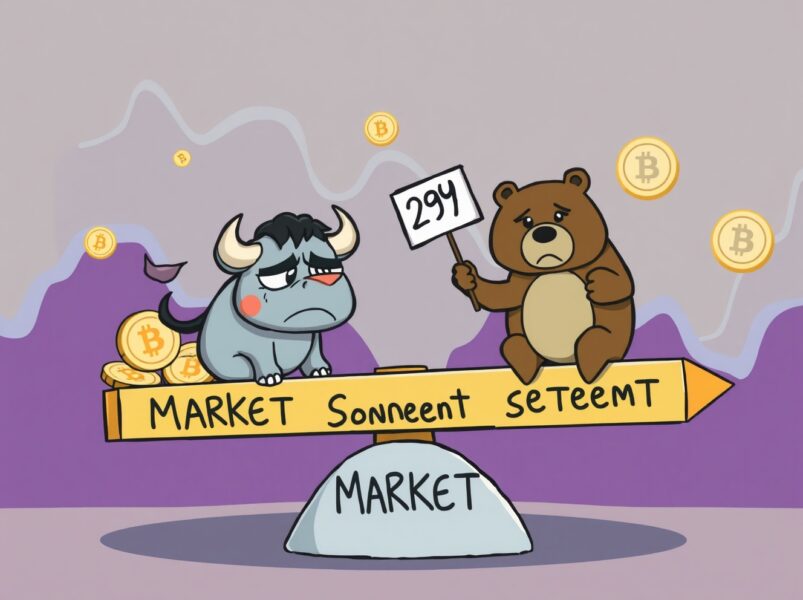
Is the crypto market finally turning a corner, or are investors still gripped by uncertainty? The latest data provides a crucial snapshot. The Crypto Fear & Greed Index has inched up to 29, a three-point gain from the previous day. However, this reading firmly keeps the market in the ‘Fear’ category. For traders and long-term holders alike, understanding this key sentiment gauge is essential for navigating the volatile landscape.
What is the Crypto Fear & Greed Index?
Think of the Crypto Fear & Greed Index as the market’s emotional pulse. Created by Alternative.me, it quantifies the collective psychology of cryptocurrency investors on a simple scale from 0 to 100. A score of 0 signals ‘Extreme Fear,’ where panic selling may dominate. A score of 100 indicates ‘Extreme Greed,’ often a precursor to a market top. The current score of 29, while improved, suggests caution still prevails.
How is This Sentiment Score Calculated?
The index isn’t just a guess; it’s a data-driven composite. The algorithm analyzes several market factors to generate its daily reading. Here is the breakdown:
- Volatility (25%): Measures price swings. High volatility often correlates with fear.
- Market Volume (25%): Tracks trading activity. Unusual volume can signal strong emotions.
- Social Media (15%): Analyzes the tone and volume of crypto conversations online.
- Surveys (15%): Incorporates data from periodic market sentiment polls.
- Bitcoin Dominance (10%): The share of the total crypto market held by Bitcoin. Shifts can indicate risk-on or risk-off behavior.
- Google Trends (10%): Tracks search interest for cryptocurrency-related terms.
By blending these inputs, the Crypto Fear & Greed Index offers a more holistic view than price alone.
What Does a Score of 29 Mean for Your Portfolio?
A reading in the ‘Fear’ zone, like 29, presents a classic contrarian opportunity. Historically, prolonged periods of fear have often preceded significant market rallies. However, it is not a guaranteed buy signal. This sentiment suggests that many investors are still skeptical or waiting on the sidelines. Therefore, it can be a time for disciplined accumulation for those with a long-term view, but it also warns that volatility may continue.
You should use the index as one tool among many. Pair it with fundamental analysis of projects and clear risk management. A fearful market can shake out weak hands, but it can also test the conviction of even seasoned investors.
Actionable Insights from the Current Fear Reading
How can you apply this knowledge? First, recognize that market sentiment is often a lagging indicator. The Crypto Fear & Greed Index confirms what has already happened. Second, consider dollar-cost averaging. Buying fixed amounts at regular intervals can be a smart strategy when sentiment is low. Finally, avoid making emotional decisions based on the fear of others. Stick to your pre-defined investment plan.
In conclusion, the rise to 29 on the Crypto Fear & Greed Index is a tentative step away from extreme pessimism, but not a leap into optimism. It reflects a market that is healing yet remains fragile. For the astute investor, this ‘fear zone’ is not a signal to flee, but a reminder to stay informed, be patient, and look beyond short-term emotions to the long-term potential of the asset class.
Frequently Asked Questions (FAQs)
Q: Is the Crypto Fear & Greed Index a reliable buy/sell signal?
A: It is a useful sentiment tool, not a standalone trading signal. Always combine it with technical and fundamental analysis before making investment decisions.
Q: How often is the index updated?
A: The Crypto Fear & Greed Index is updated daily, providing a near real-time gauge of market emotion.
Q: Does it only track Bitcoin?
A> While Bitcoin is a major component (via its dominance metric), the index is designed to reflect sentiment across the broader cryptocurrency market.
Q: What reading indicates ‘Neutral’ sentiment?
A> Scores typically between 46 and 54 are considered neutral, indicating a balanced market without strong fear or greed.
Q: Has the index been accurate in predicting market turns?
A> It has been historically effective at identifying periods of extreme emotion (like ‘Extreme Greed’ near tops or ‘Extreme Fear’ near bottoms), which often coincide with market reversals.
Q: Where can I check the current index score?
A> The index is publicly available on websites like Alternative.me and is often featured on major crypto news and data platforms.
Found this breakdown of the Crypto Fear & Greed Index helpful? Share this article with fellow investors on social media to help them decode market sentiment and make more informed decisions!
To learn more about the latest crypto market trends, explore our article on key developments shaping Bitcoin and altcoin price action.
This post Crypto Fear & Greed Index: Market Sentiment Stuck at 29 in Fear Zone first appeared on BitcoinWorld.
You May Also Like
XRP stuck in range as descending channel caps upside momentum

Microsoft Corp. $MSFT blue box area offers a buying opportunity