Published: Nov 24, 2025 at 14:06
Updated: Nov 24, 2025 at 15:21
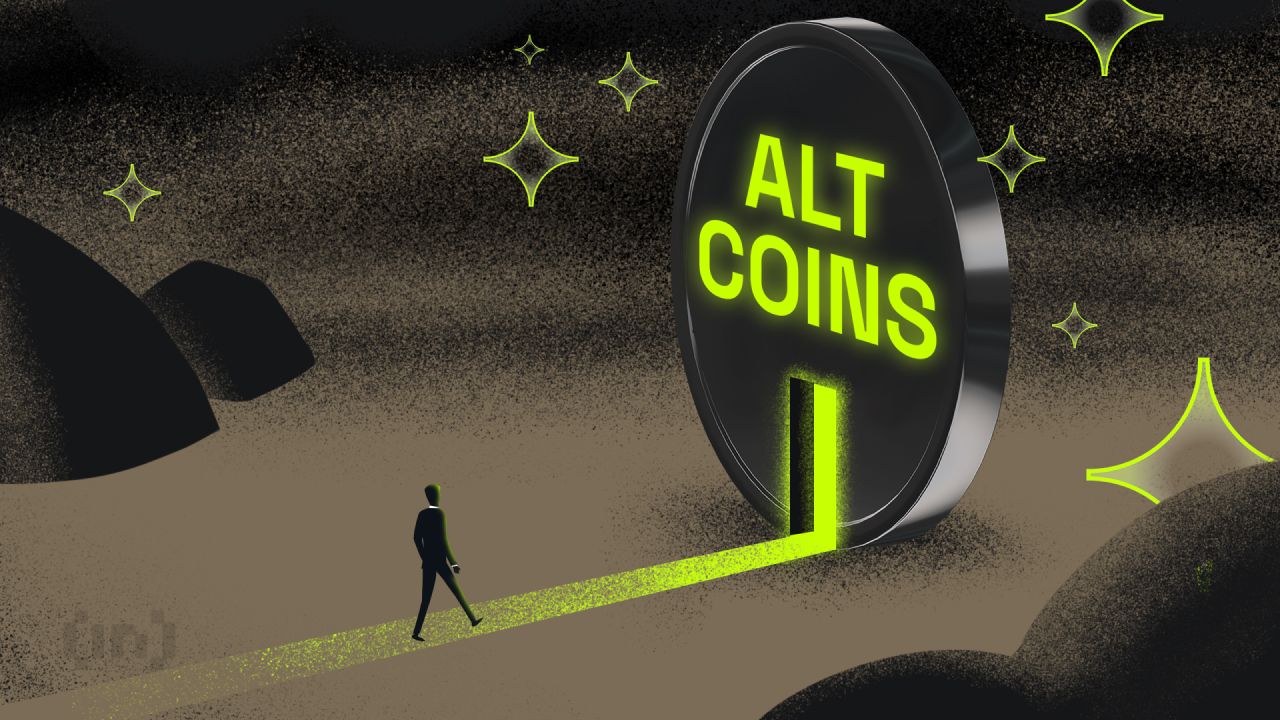
The cryptocurrencies listed below have fallen to the bottom of the chart.
However, the presence of Doji candlesticks has limited their upward movement. There is a possibility that these cryptocurrencies will continue to rise if buyers push the price above the moving average lines.
MYX Finance
MYX Finance (MYX) is moving horizontally as it consolidates above the $1.70 support level. The price has broken above the 21-day SMA, but the upward movement has been restricted by the 50-day SMA.
Currently, the asset is trading between the two moving average lines. The altcoin will establish a trend once it breaks above either the 21-day or the 50-day moving average. The price action has featured small-bodied, indecisive candlesticks known as Doji. The altcoin is likely to remain range-bound for a few days. MYX is currently the top-performing cryptocurrency.
-
The current price: $2.87 -
Market capitalization: $635,861,636.23 -
Trading volume: $39,024,681.2 -
7-day gain: 14.77%
Pi
Pi (PI) is now trading above the $0.19 support level at the bottom of the chart. The price is moving between the $0.26 high and the $0.19 support. The movement has been steady, with Doji candlesticks forming near the bottom of the chart. The price has found support above the moving average lines after breaking above them. If PI remains above the moving average lines, it is expected to rise. The cryptocurrency could reach a high of $0.35 if it breaks above $0.26.
-
The current price: $0.2417 -
Market capitalization: $2,013,205,974.08 -
Trading volume: $25,706,635.7 -
7-day gain: 6.27%
World Liberty Financial
The price of World Liberty Financial (WLFI) is moving sideways near the bottom of the chart. The cryptocurrency is currently trading above the $0.10 support but below the $0.16 high. The price fluctuates both below and above the moving average lines. The price bars are above the horizontal moving average lines as the cryptocurrency prepares to move into the positive trend zone. If buyers break above the current barrier, the price could rise to a high of $0.22. WLFI is the third-best-performing cryptocurrency.
-
The current price: $0.1499 -
Market capitalization: $3,689,243,331.63 -
Trading volume: $172,337,866.36 -
7–day gain: 4.07%
Artificial Superintelligence Alliance
The Artificial Superintelligence Alliance (FET) is also in a sideways trend and has dropped to the bottom of the chart. The cryptocurrency is trading above the $0.20 support but below the $0.40 high. The 21-day and 50-day SMA barriers have slowed the price increase.
On November 7, the price rose above the moving average lines but was pushed back. The long candlestick wick above the moving average lines on November 7 indicates considerable selling pressure at the recent peak. Currently, the price has dropped between the moving average lines.
-
The current price: $0.2807 -
Market capitalization: $661,576,522.57 -
Trading volume: $104,242,627.02 -
7–day gain: 3.95%
UNUS SED LEO
The UNUS SED LEO (LEO) price is trading sideways below the $9.80 overhead barrier. The cryptocurrency is trading above the moving average lines but below the $9.80 high. The upward movement has been further limited below the $9.60 high. The price is moving in a narrow band between the $9.00 support and the $9.80 high. The price movement has been static within its range.
-
The current price: $9.46 -
Market capitalization: $8,729,931,555.34 -
Trading volume: $630,210.64 - 7–day gain: 3.85%
Disclaimer. This analysis and forecast are the personal opinions of the author. The data provided is collected by the author and is not sponsored by any company or token developer. This is not a recommendation to buy or sell cryptocurrency and should not be viewed as an endorsement by Coinidol.com. Readers should do their research before investing in funds.
Expert in finance, blockchain, NFT, metaverse, and web3 writer with great technical research proficiency and over 15 years of experience.
Source: https://coinidol.com/weekly-altcoins-steadily-rise/