

SanDisk Stock Plunges 11% After Record High—Is the Bull Case Intact?

SanDisk stock (SNDK) suffered an ~11% intraday plunge Tuesday before recovering to close at $1,963.60. The drop followed a record-high close the prior session and was driven by a cascading memory chip sell-off triggered by South Korea’s Kospi crash. The daily chart remains structurally bullish, though short-term signals demand caution.
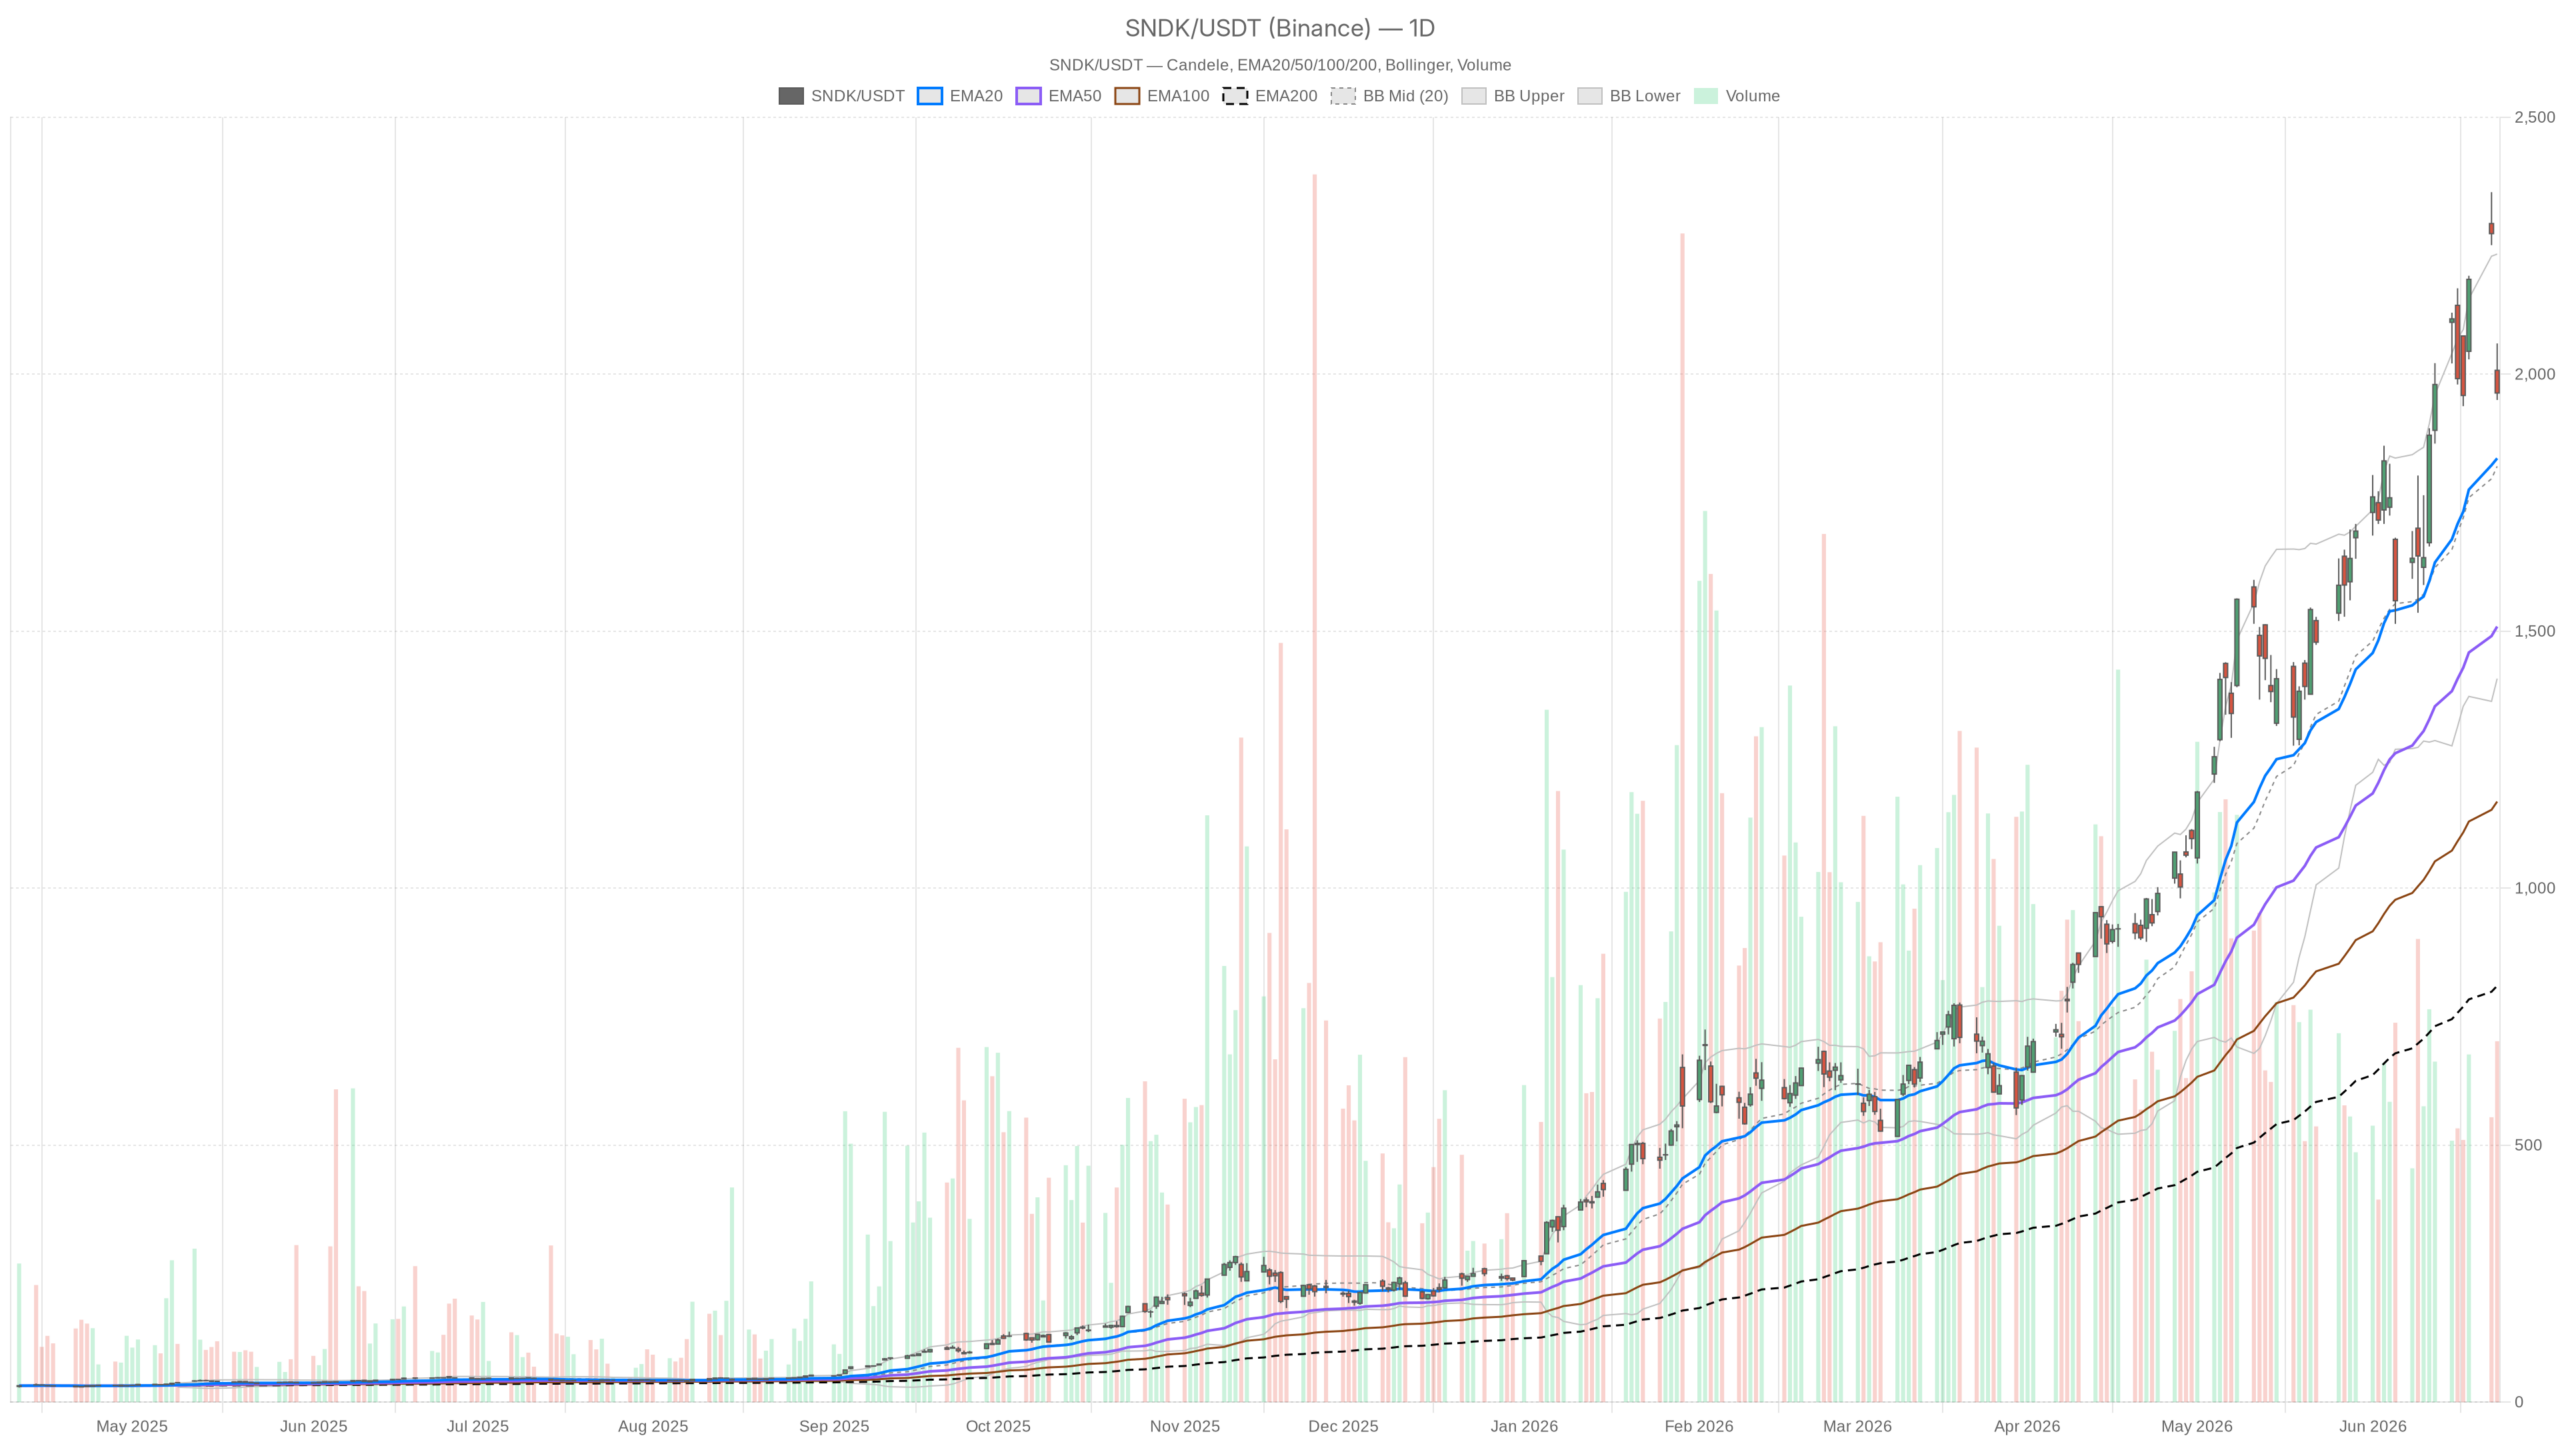 SNDK — daily chart with candlesticks, EMA20/EMA50 and volume.
Key takeaways
- SNDK’s daily trend is firmly bullish, with all three EMAs stacked and the MACD histogram positive at 15.14.
- Hourly momentum has turned sharply negative; price sits below both the 20-hour and 50-hour EMAs.
- Tuesday’s sell-off was macro-driven, not company-specific. AI demand fundamentals for SanDisk remain intact.
- Key support sits at $1,922–$1,945. Bulls need stabilization evidence before adding exposure.
- With a daily ATR of $191, single-day swings of $200 or more are statistically normal for this stock.
Daily Timeframe: SNDK Trend Remains Intact
Yes, SanDisk stock’s daily trend remains firmly bullish. Price holds above all three key EMAs, and the daily MACD has not reversed despite Tuesday’s sharp sell-off.
All three EMAs are stacked in textbook uptrend formation. Price sits well above the 20-day EMA at $1,836, the 50-day EMA at $1,509, and the 200-day EMA at $810. That magnitude of separation reflects SNDK’s roughly 10x rally from its longer-term base levels.
Notably, the daily MACD reinforces this picture. The MACD line at 189.86 remains comfortably above its signal line at 174.71, with a positive histogram of 15.14. Momentum has not reversed at the daily level.
Meanwhile, the RSI at 57.79 has pulled back meaningfully from overbought territory without entering oversold conditions. That is precisely the kind of reset healthy uptrends produce before continuing higher — not a breakdown signal.
Overall, Bollinger Bands show price sitting between the midline ($1,820) and the upper band ($2,233), after briefly approaching the upper range. The daily ATR of $191 underscores that SNDK is a high-volatility instrument. Single-day swings of $200 or more are statistically normal at this price level. The daily pivot point sits at $1,991, with S1 support at $1,922 and R1 resistance at $2,032. Tuesday’s close of $1,963 holds above S1, preserving near-term structural integrity.
Hourly Timeframe: Short-Term Deterioration Is Real
The short-term deterioration on the hourly chart is genuine. Price now sits well below both the 20-hour EMA ($2,089) and the 50-hour EMA ($2,042), confirming an intraday bearish shift.
The hourly regime is classified as neutral, but that label understates the deterioration relative to where SNDK was 24 to 48 hours ago. The hourly MACD is sharply negative, with the MACD line at -26.06 and the histogram at -40.43. That level of negative momentum suggests sellers are not yet exhausted.
At the same time, the hourly RSI at 34.84 is approaching oversold territory, close to the 30 threshold. However, it has not yet reached the kind of extreme that typically precedes sharp reversals. The hourly Bollinger midline sits at $2,156, far above current price, confirming SNDK has broken well below its recent hourly mean.
Still, the 1H pivot at $1,966 with S1 at $1,945 gives a tight band of support. A sustained break below $1,945 on the hourly would increase short-term downside risk meaningfully.
15-Minute Chart: Faint Signs of Stabilization
The 15-minute chart offers faint early signals of stabilization — not a confirmed reversal, but a potential pause in selling pressure. The MACD histogram has turned slightly positive at 9.34, even as the MACD line remains deeply negative at -43.16.
That divergence hints at decelerating selling pressure. However, the 15-minute RSI at 33.92 mirrors the hourly, sitting just above oversold. Price is pressing toward the lower Bollinger Band at $1,946, which aligns closely with the 15-minute S1 at $1,946.87. This zone is worth watching for short-term bounce attempts.
Fundamental Backdrop: AI Demand vs. Market Panic
No, Tuesday’s sell-off was not driven by company-specific bad news. The decline stemmed from macro contagion. Korea’s market crash hit SK Hynix and Samsung, then spread to U.S. memory names.
In fact, analysts at Morgan Stanley have characterized AI as fundamentally changing the NAND market. SanDisk specifically benefits from rising cloud demand and a structural shift toward TLC and QLC architectures. A separate Seeking Alpha analysis published the same day argues SNDK remains investable even after its 10x rally. It cites robust demand and a shift to long-term contractual revenue streams. These are not signs of a business in distress.
Bullish Scenario for SanDisk Stock: Trend Continuation After Reset
The bull case depends on SNDK holding above the $1,922 daily S1 level and the daily MACD remaining positive. A recovery through the $1,991 pivot and then $2,032 R1 resistance would signal the rebound is underway.
In that scenario, this correction fits the profile of a normal digestion phase within a larger uptrend. Renewed strength in global AI infrastructure spending narratives — or a stabilization in Korean chip markets — could reignite institutional buying. The daily MACD staying positive is the key confirmation signal to watch.
Bearish Scenario: Momentum Reversal Takes Hold
The bear case gains traction if SNDK fails to recover above its 1H EMAs, which cluster between $2,042 and $2,089. Should the daily MACD histogram begin to flatten or turn negative, the correction could deepen toward the $1,700–$1,800 range. In that zone, the daily Bollinger midline and the 20-day EMA converge, creating a secondary support area.
A sustained break below the $1,922 daily S1 would be the clearest near-term warning sign. Broader macro deterioration — particularly further weakness in Korean memory names or a broader AI spending reassessment — would compound the pressure.
Positioning in a High-Volatility Environment
SNDK presents a classic conflict between a strong daily trend and real short-term damage. The daily regime remains bullish, but the hourly signals demand respect.
Overall, with an ATR of $191 on the daily and $65 on the hourly, this stock moves fast in both directions. Traders looking for exposure should weigh the $1,922–$1,945 support cluster carefully. Bulls need stabilization evidence before adding; bears need a clear daily-level breakdown to gain conviction. The next 24 to 48 hours will be decisive in determining whether Tuesday was a buying opportunity or the start of a more significant correction.
FAQ
Is SanDisk stock’s daily uptrend still intact after Tuesday’s sell-off?
Yes. The daily trend remains structurally bullish with all three EMAs stacked positively, the MACD histogram still positive at 15.14, and price holding above the $1,922 daily S1 support. Tuesday’s sell-off has not broken the trend structure.
What caused SanDisk stock to drop ~11% intraday?
The sell-off was macro-driven, triggered by a crash in South Korea’s Kospi index that hit SK Hynix and Samsung. Contagion spread to U.S. memory chip names including SNDK, despite no company-specific negative news.
Where are the key support levels for SNDK right now?
The critical support cluster sits at $1,922 (daily S1) to $1,945 (hourly S1). A sustained break below this zone would increase short-term downside risk. Below that, the $1,700–$1,800 range — where the daily Bollinger midline and 20-day EMA converge — provides secondary support.
Is the current pullback a buying opportunity in SanDisk stock?
Potentially, but confirmation is needed. The daily trend remains bullish and the RSI reset from overbought territory is healthy. However, the hourly chart still shows negative momentum. Bulls should wait for stabilization evidence — such as a recovery above the $1,991 pivot — before adding exposure.
Disclaimer: This article is for informational purposes only and does not constitute financial advice, an investment recommendation, or a solicitation to buy or sell any financial instrument or cryptocurrency. The analysis provided is not indicative of future results. Investing in crypto assets and financial markets carries a high risk of capital loss. Always do your own research (DYOR) and consult a qualified financial advisor before making any decision.
Article produced with the assistance of artificial intelligence and reviewed by the editorial team.


You May Also Like

Micron (MU) Stock: Wall Street Anticipates Record-Breaking Q3 Results Wednesday

Meta Bets on Prediction Markets as It Hunts for Next-Growth Engine (Report)

XRP struggles below key resistance amid geopolitical tensions


