

BTC Hits Key Support Zone: Next Bullish Leg Up Loading? (18 June 2026)
The $BTC price has come down to the bottom of a potential bear flag and has also tagged support at $63,700. With this relatively firm base beneath, Bitcoin looks set to embark on the next leg up. $69K is a possible target.
Back to the top of the bear flag?
Source: TradingView
The short-term time frame reveals that the $BTC price has come down to the bottom of the potential bear flag and has touched base at the $63,700 horizontal support level. Given the bottoming of the Stochastic RSI indicators, it would be a decent probability that the price rises from here.
If the $66K horizontal resistance level can be overcome again, the price is likely to keep rising to the top of the bear flag, providing the 3rd touch point to make this flag fully valid. The 200 SMA is coming down into this area and will also provide resistance.
If on the other hand the bears manage to drag the $BTC price down through the bottom of the flag, the bull market trendline is likely to lend strong support.
One last move back to $69K then down?
Source: TradingView
The daily chart would suggest that the $BTC price is destined to continue going down. It just remains to be seen if the bulls will push the price up to the top of the bear flag one more time first. A descending trendline can also lend its weight to a rejection if the price should get there.
There could be a bounce from the Stochastic RSI indicators, which could allow the price to get back to the top of the bear flag, but overall, when the Stochastic RSI indicators in this time frame go down, the price generally always falls with them.
$66K is key at weekly close
Source: TradingView
In the weekly time frame the most important thing to note is that the $BTC price is still below the critical $66K horizontal level. If the bulls can hold above by the end of this Sunday this could lead to some serious upside price action if a new weekly candle opens above next week. By the same token, if the price stays below $66K, the 200-week SMA and the bull market trendline could be at risk.
At the bottom of the chart, the Stochastic RSI indicator lines continue to fall. At this rate of descent, the indicator lines could be at the bottom by the end of the month. If the bounce is a clean one, the indicator lines could be passing the 20.00 level on their way back up by mid-July, providing some serious upside price momentum.
Of course, the previous conjecture is based on everything going smoothly and in favour of the bulls. Generally, the market prefers to follow a far more tortuous path. However, even if this will be the case, the bear market is running down towards completion, and by the end of this year the new bull market will likely have begun.
Disclaimer: This article is provided for informational purposes only. It is not offered or intended to be used as legal, tax, investment, financial, or other advice.


You May Also Like

Dow Jones futures plunge as risk aversion increases after Trump’s comments
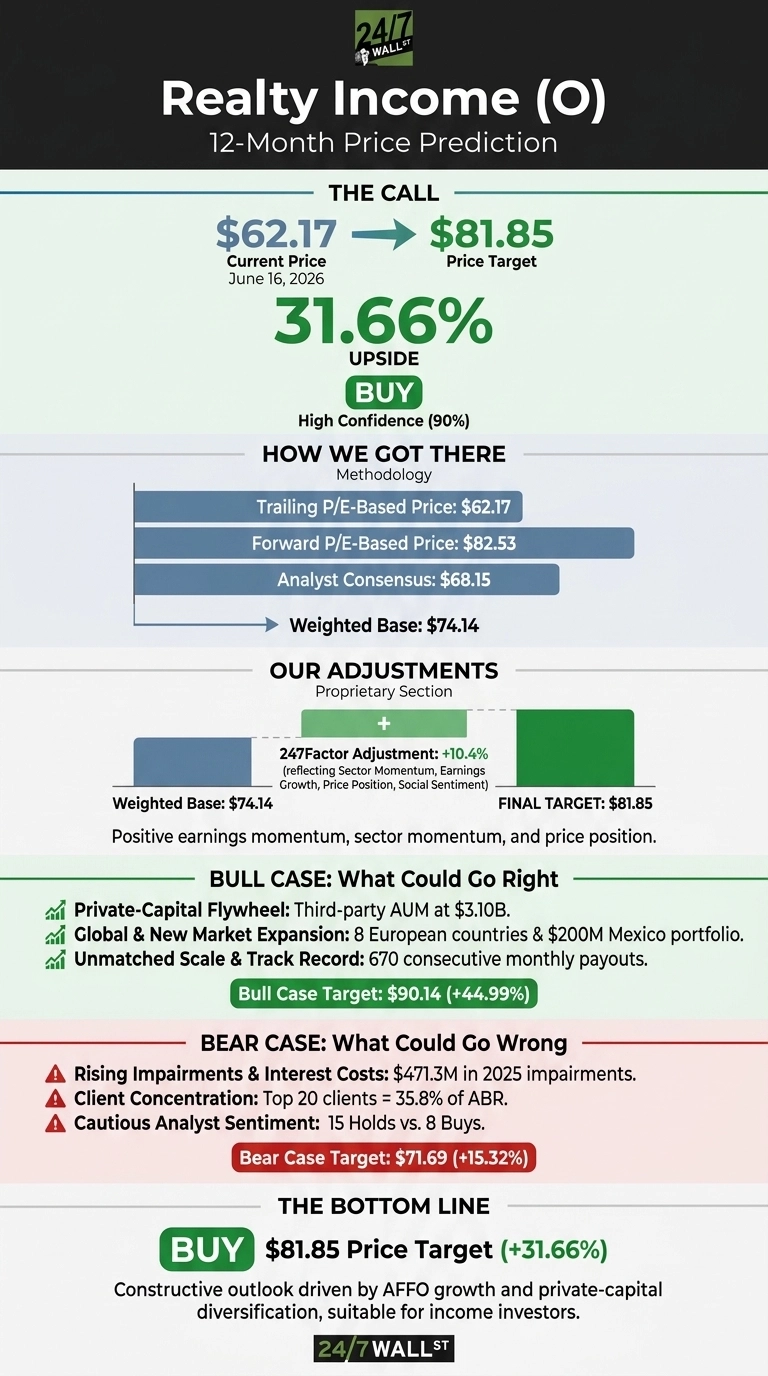
Our Highest Conviction Call on Realty Income Points to 30% Upside

Richard Harris Law Firm Partners with CCSD to Honor School Bus Drivers at Appreciation Event


