

Zcash Price Prediction: Analyst Predicts Further ZEC Upside After $440 Breakout
Key highlights:
- Zcash reclaimed $440, with charts targeting a move toward $520-$600 if support holds.
Upgrades on the Zcash network, as well as potential ETF demand, is expected keep driving the ZEC price higher.
On-chain data remains mixed, but technical indicators continue favoring ZEC.
Zcash has started gaining momentum as it managed to break above the significant resistance area, creating hopes of a further upsurge from the bears’ end. According to crypto analyst Ardi, breaking out of $440 will have a positive impact on the short term trend, setting the stage for a move back towards $520-$600 levels.
The optimism comes at a time when Zcash is benefiting from more than technical momentum. Upcoming network upgrades, growing institutional interest, and improving sentiment across the altcoin market are all giving the privacy coin fresh support.
ZEC price holds above a critical breakout level
One of the biggest occurrences with regard to the ZEC price is its ability to break above the level of $440. According to Ardi, breaking out of the lower highs has made it invalid for some weeks where the sellers dominated.
Prior to going higher, ZEC was seen trading at a level above $405 with limited volumes. As long as the ZEC price stays above $440, the next target remains $480, followed by the $520 area that previously acted as the base of the right shoulder formation.
There is still a note of caution. The preceding rally generated both the double top pattern and head and shoulders pattern that occur in a market near a top formation. The negative expectation will be neutralized if the buyers manage to defend $440 and take the ZEC price above the latest peaks.
The ZEC chart still favors higher prices
We had a look at the 4-hour ZEC chart, and the bullish structure remains easy to spot. The reverse head and shoulders formation began when a left shoulder was created at about $300-$320, and then there was a stronger dip down to $220-$240 where the head was created. The right shoulder was formed at $340-$360.
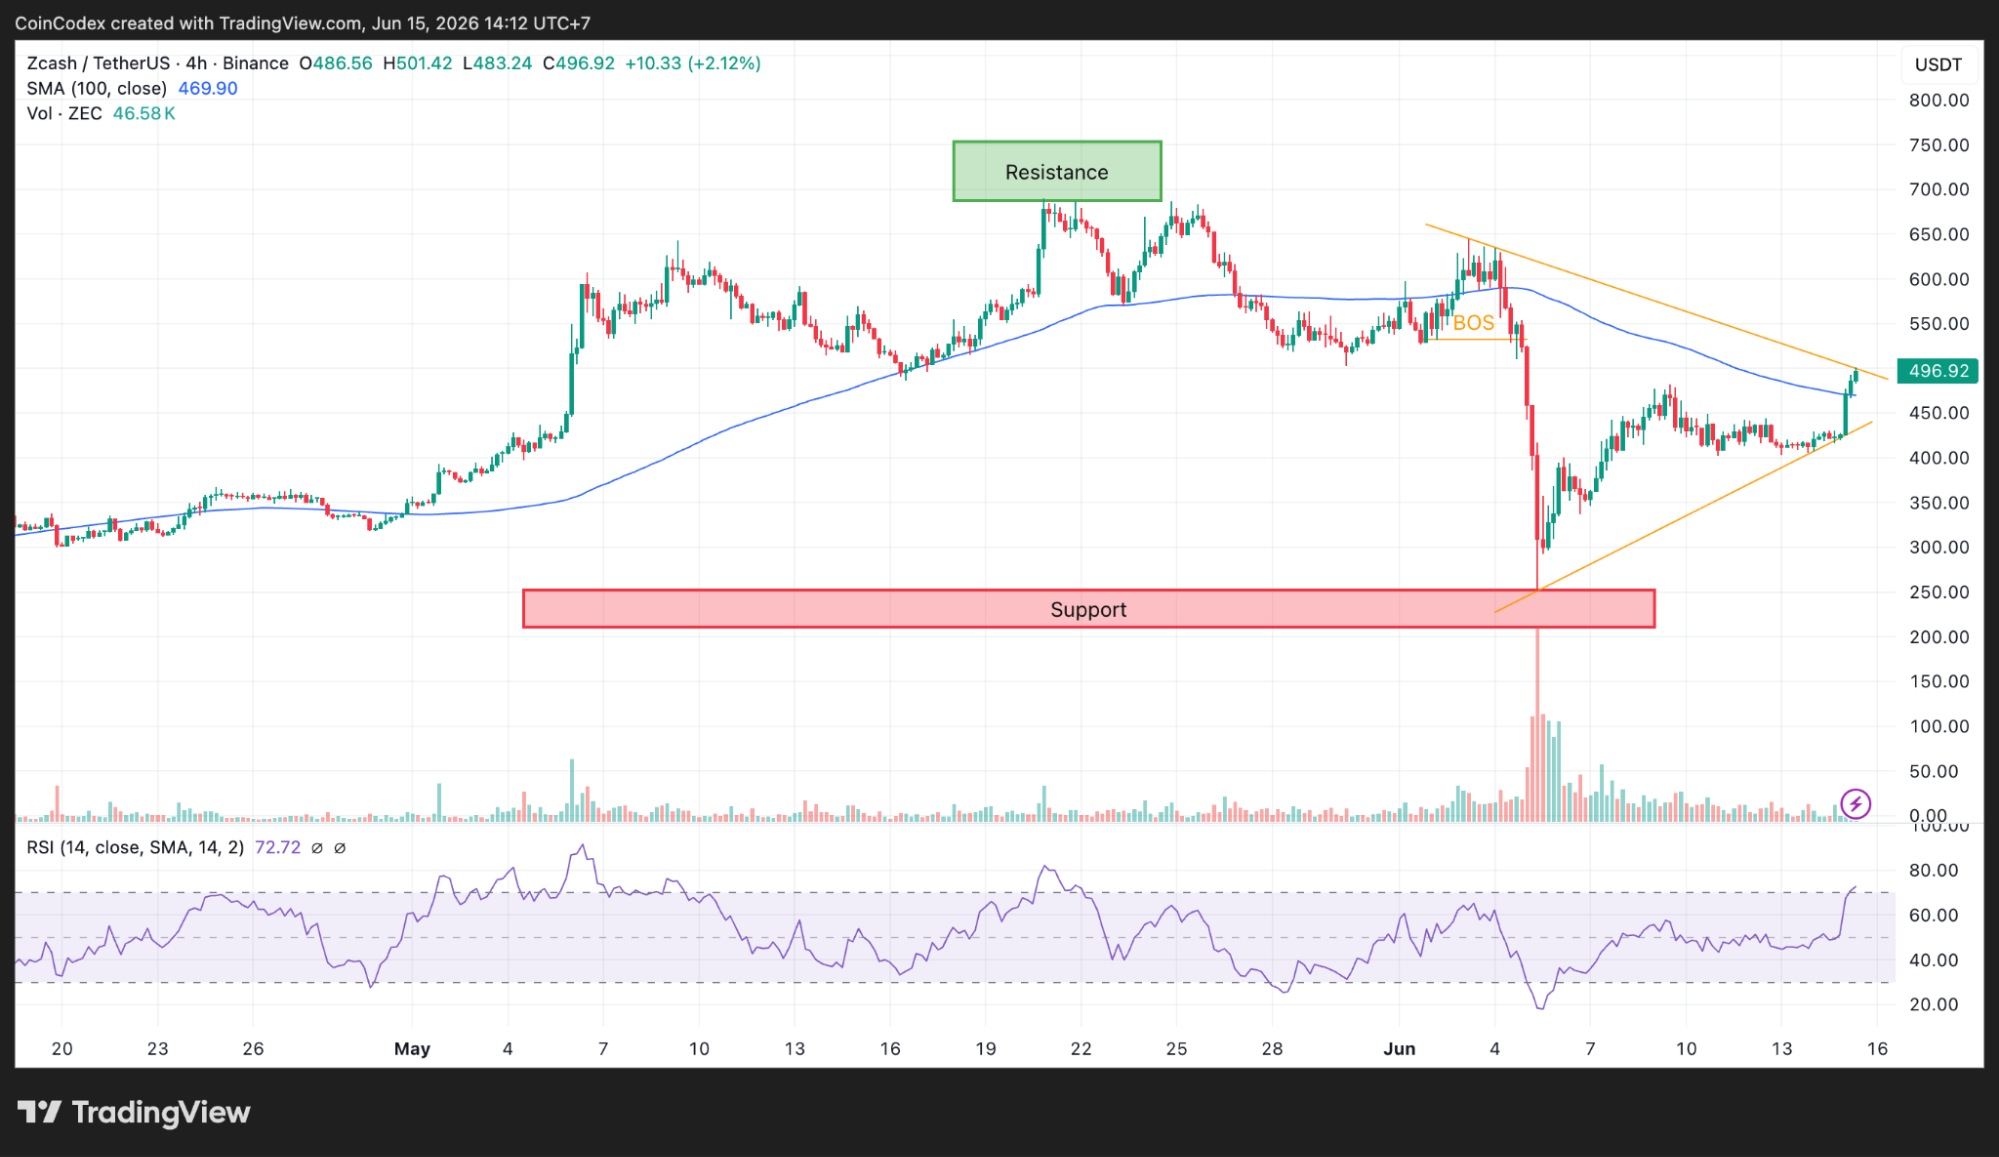
4-Hour ZEC chart analysis
The neckline was positioned near $420, and the ZEC price has already moved comfortably above it, trading around $460. Using the standard measured move for this pattern, the distance between the head and the neckline is roughly $190. Adding that to the breakout point produces an upside target close to $610.
Volume also supports the setup. Trading activity gradually declined throughout the pattern, indicating selling pressure faded over time. A move above $500 with stronger buying volume would strengthen the case for another leg higher.
The daily chart paints an encouraging picture for the ZEC price. Trading around $497, ZEC remains well above its 100-day Simple Moving Average at $392.19, placing the token roughly 27% above one of its most important trend indicators.
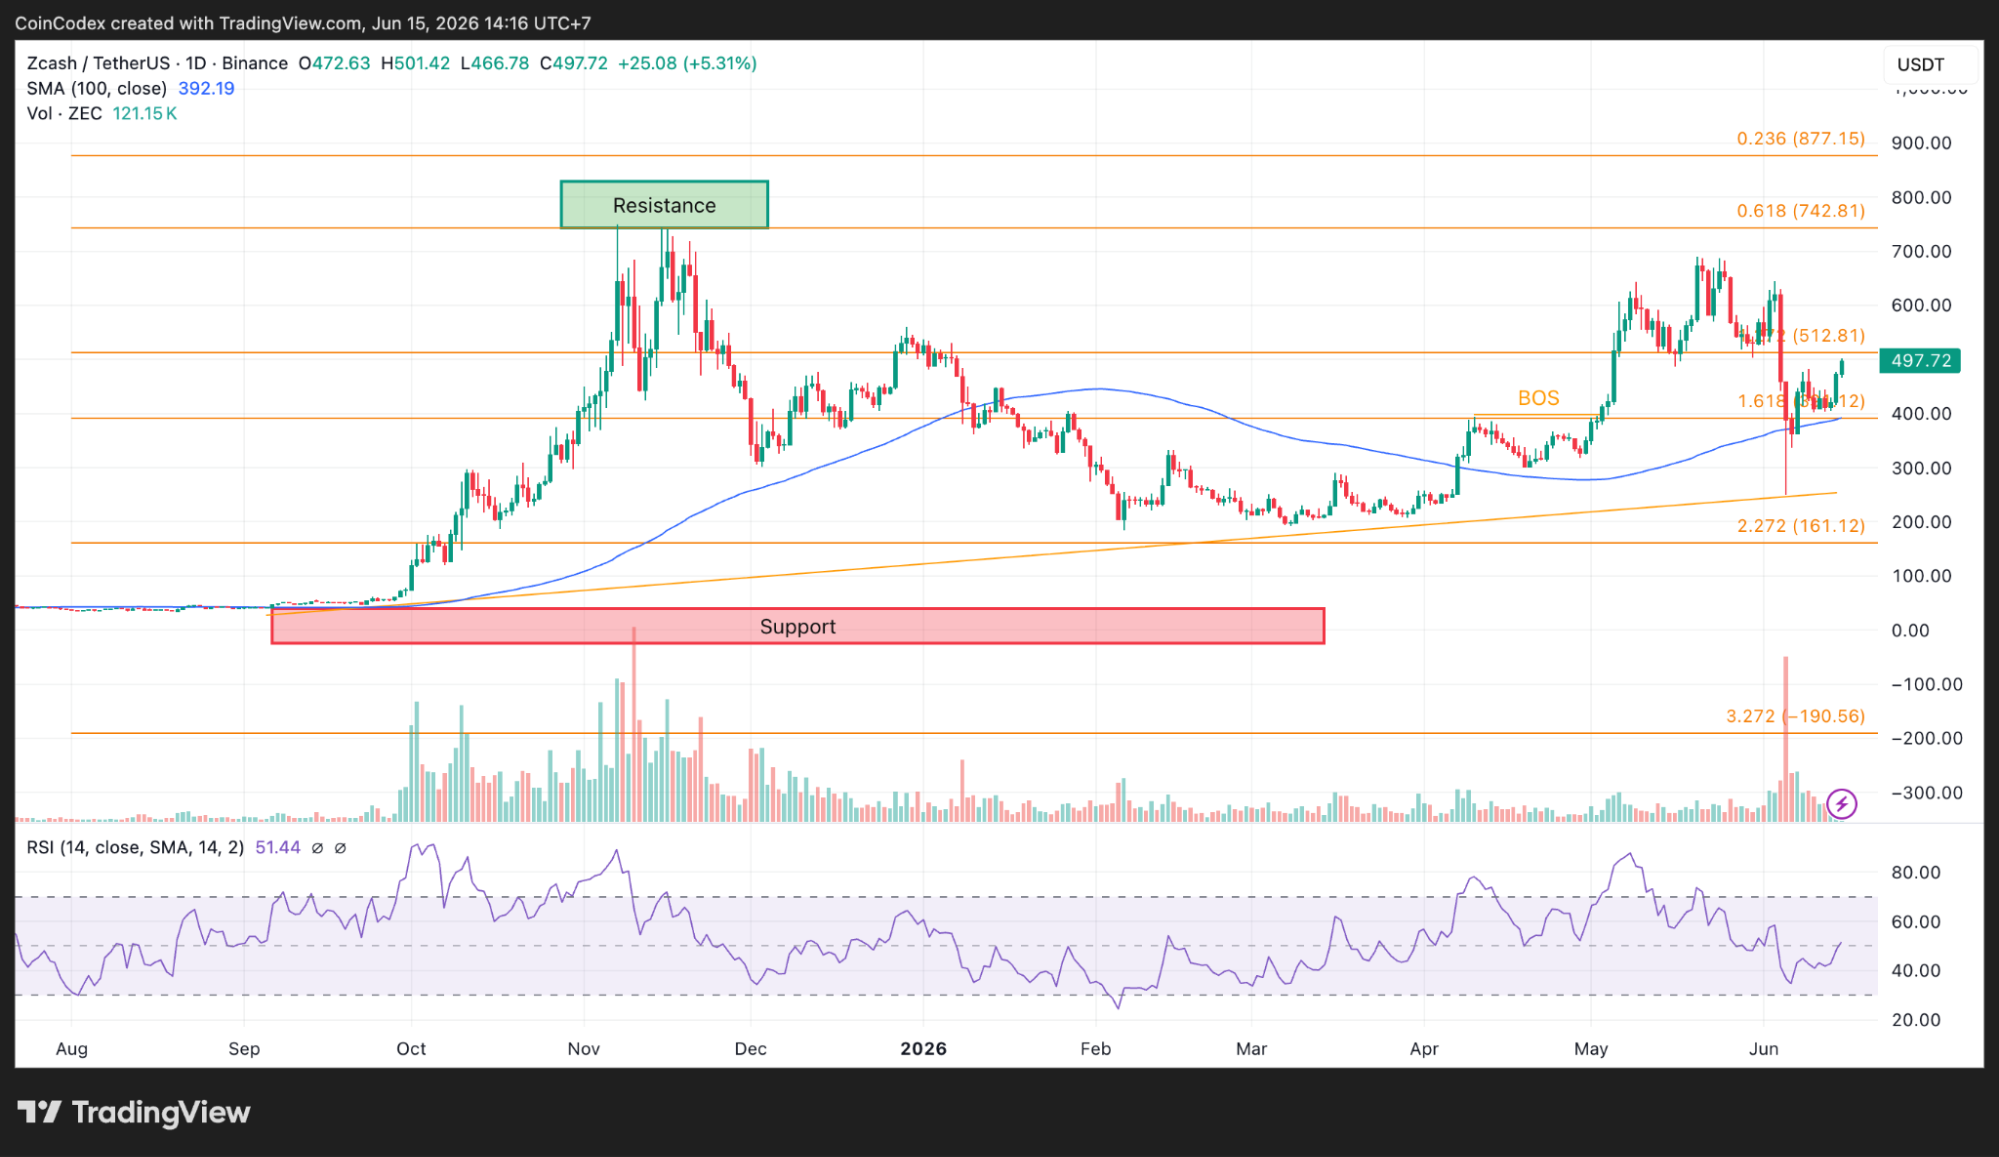
Daily ZEC chart analysis
The daily chart also confirmed a break of structure after moving above the previous swing high near $400-$420, ending the sequence of lower highs that defined the earlier downtrend. Momentum is healthy without being stretched. The daily RSI stands at 51.44, leaving plenty of room for buyers to stay active.
The shorter 4-hour RSI is higher at 72.72, which means a brief consolidation would not be unusual before another attempt at breaking resistance. If buyers clear the $500-$512 area, the next technical targets come into view at $600 and the 0.618 Fibonacci retracement level near $742.
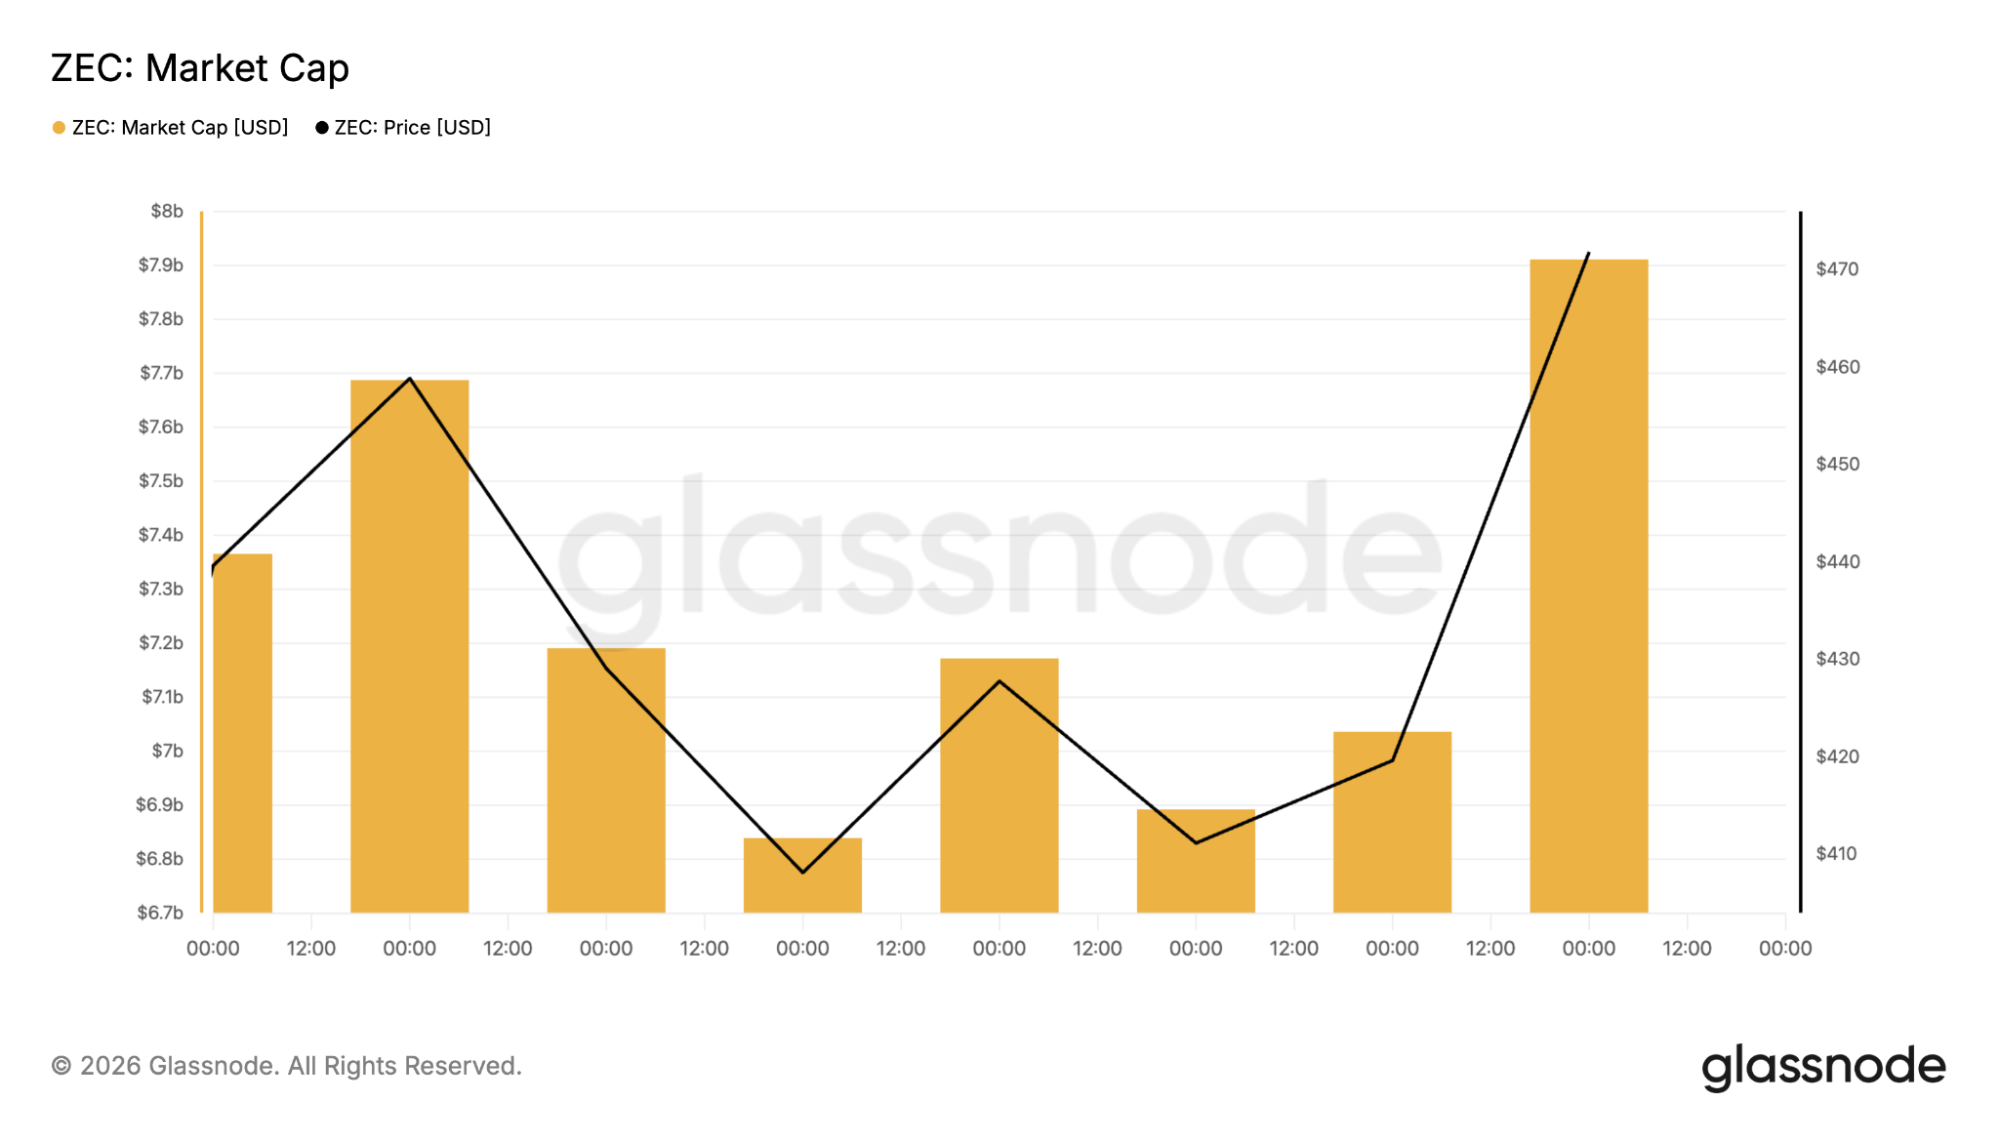
Zcash on-chain data offers a different perspective
Not every metric points in the same direction. Zcash's market capitalization has fallen from roughly $8 billion to around $6.7-$6.8 billion during the observed period, representing a decline of approximately 15%. That means capital has continued leaving the network despite the improving chart structure.
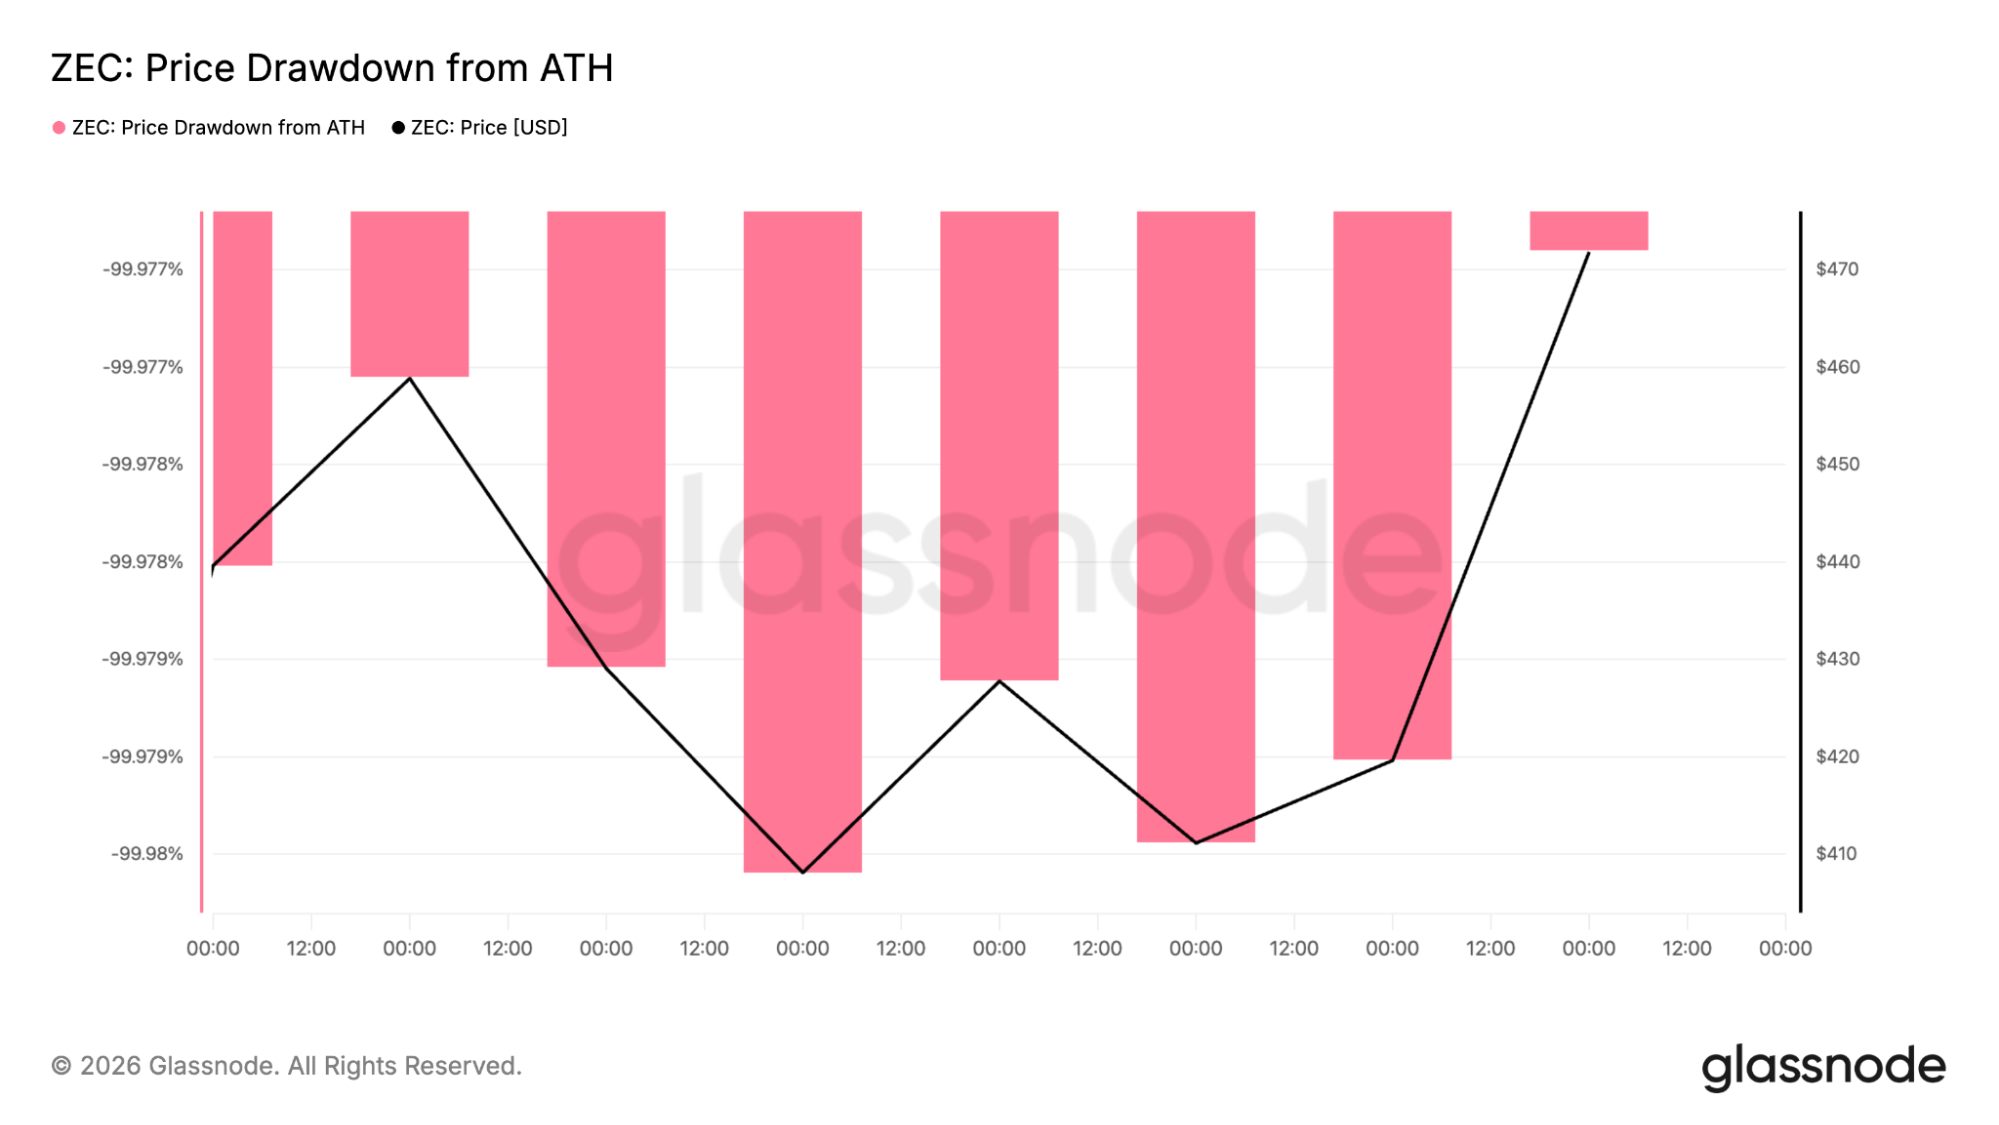
Looking further back, the ZEC price is still far below its all-time high of $3,191.93 reached in 2017. Even with the recovery toward the $500 level, the token remains about 86% below that peak.
The contrast is clear. Technical indicators favor additional upside over the short term, but stronger capital inflows would provide much stronger confirmation that the rally has staying power.
Fundamentals could keep supporting the ZEC rally
The project itself has several developments that traders are watching closely. Network Upgrade 7, expected later in 2026, will introduce Shielded Assets and Project Tachyon, with developers targeting transaction speeds that are up to 300% faster than the current network.
Zcash is also working on quantum-recoverable wallets, creating another narrative that separates it from many competing privacy coins.
Institutional interest continues to build as well. Grayscale has filed for a spot ZEC ETF, and the SEC closed its investigation into the Zcash Foundation in May 2026 without taking enforcement action, removing one source of regulatory uncertainty.
The broader market environment has also improved. The Altcoin Season Index moved from 29 to 51 over the past month, showing that capital is beginning to rotate beyond Bitcoin into alternative cryptocurrencies.
Where could the ZEC price go next?
The next few trading sessions will likely revolve around one level: $500. A successful breakout through such resistance levels will push the price higher to $520, then higher to $550, and finally towards $600 based on the inverse head-and-shoulders pattern.
The continuation of the upward momentum in the market may even push the price to reach the $742 Fibonacci extension level. The bearish case is simple, whereby the breaking of the $420 support level will lead to lower prices around $340-$360.
As for now, the ZEC price continues to remain above significant moving averages and is still in an intact bullish formation, along with new upcoming developments. Those factors are giving buyers plenty of reasons to stay active as the market looks for its next move.
According to CoinCodex’s 1-month ZEC price prediction, the ZEC price could climb to $685.60, pointing to notable upside from current levels if bullish momentum continues over the coming weeks.


You May Also Like
Strive (ASST) Acquires 73 Bitcoin for $4.7 Million, Pushes Treasury to 19,105 BTC

2026 World Cup Belgium vs Egypt Prediction: Match Result, Score Forecast and Key Players

2026 World Cup Spain vs Cabo Verde Prediction: Match Result, Score Forecast and Key Players


