

XRP (XRP) Bounces From $1.05 Low as Analysts Call Market Bottom and Target $1.30 Breakout
Key Takeaways
- XRP maintains position above $1.14 after touching $1.05 during the latest market-wide selloff
- Technical indicators reveal bullish RSI divergence, with market analysts eyeing $1.30 as the next significant level
- Derivatives market activity has cooled, with Futures Open Interest declining from $2.96 billion to $2.45 billion since early June
- XRP ETF activity shows inconsistent patterns, recording no inflows on Thursday despite earlier weekly gains; total cumulative inflows reach $1.43 billion
- Price action remains constrained below all primary moving averages, with the 50-day EMA positioned near $1.30 serving as critical overhead resistance
Ripple’s native digital asset is currently changing hands near $1.14 following a rebound from its June bottom at $1.05. The recent downturn eliminated stop-loss orders and cleared out overleveraged positions before demand reemerged in the market.
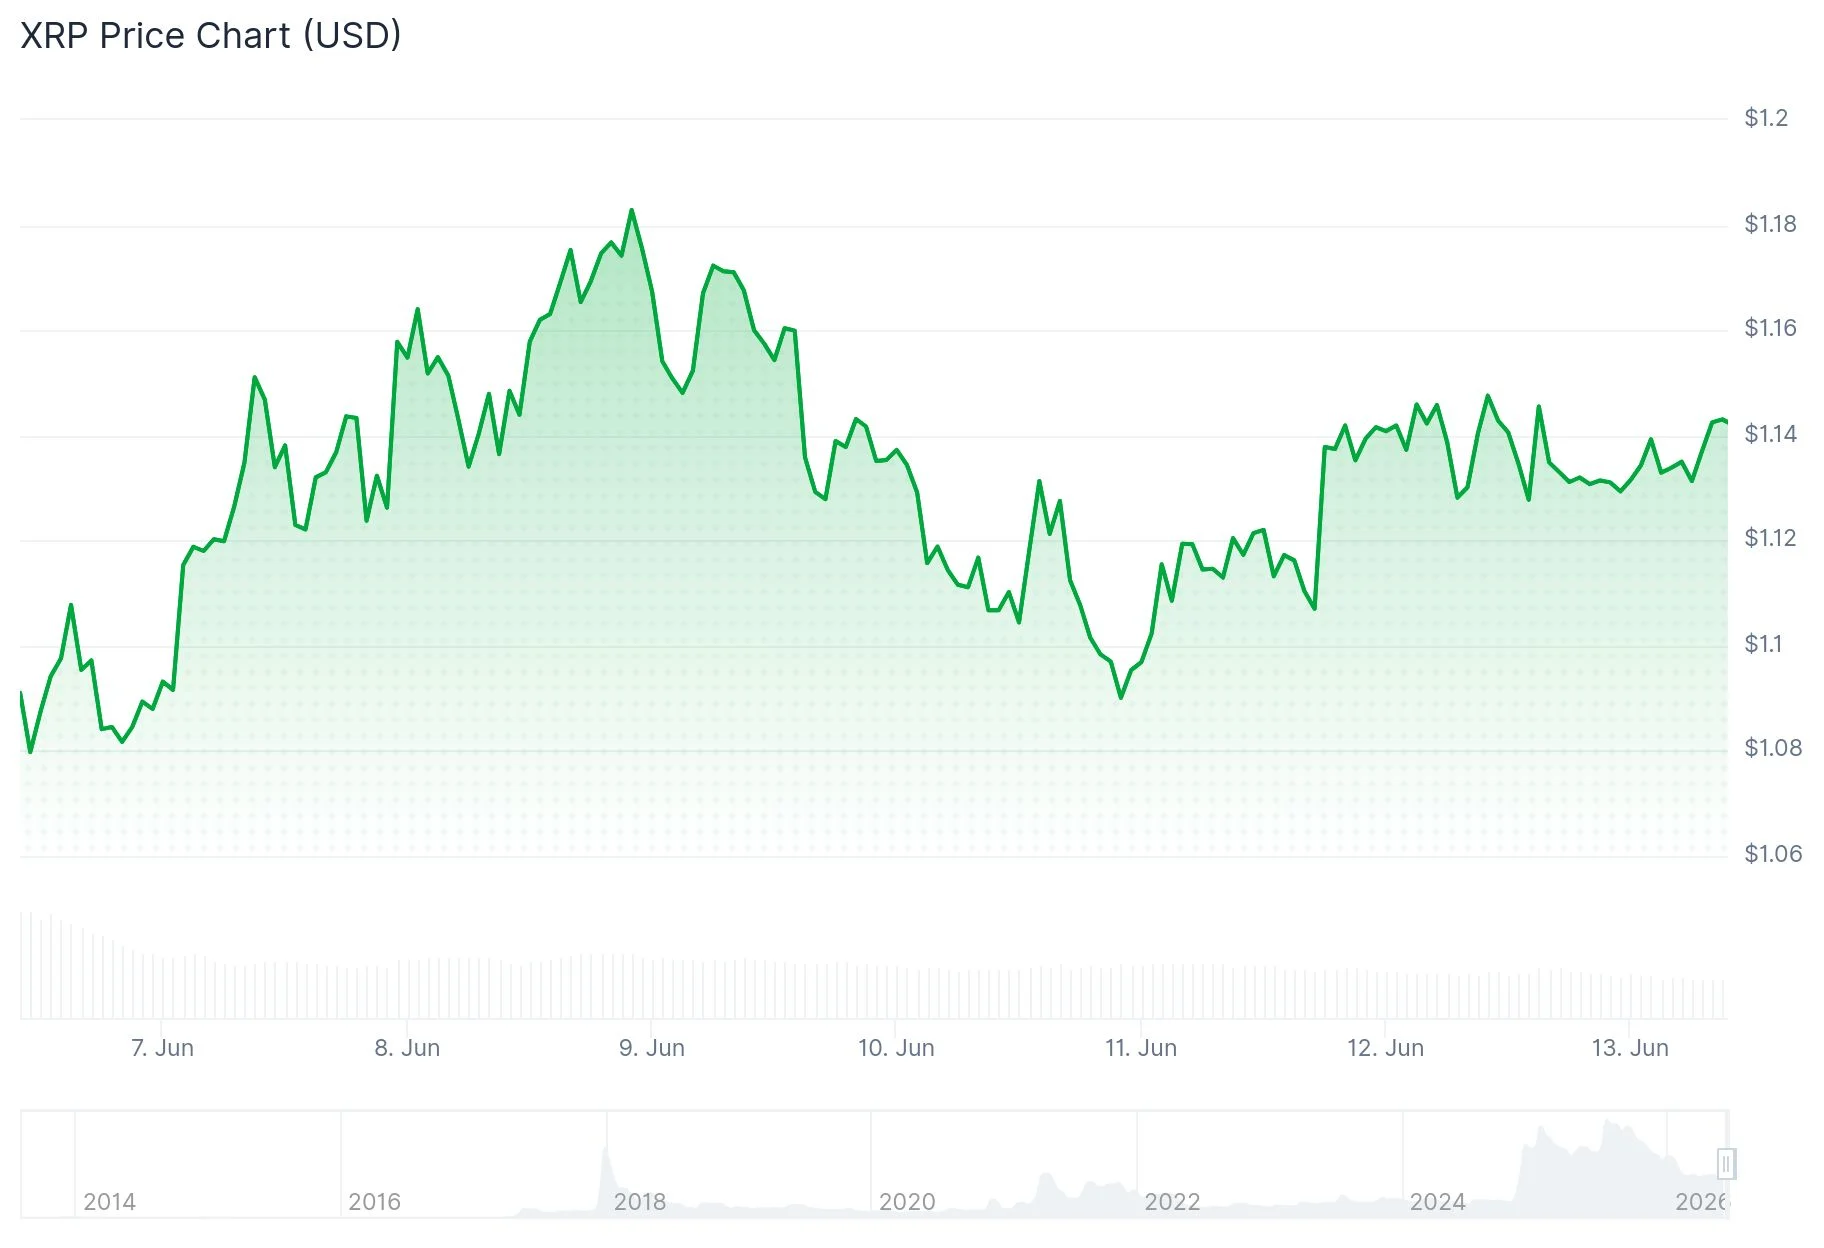 XRP Price
CryptoPulse, a prominent market technician, characterized the price action as a “capitulation flush,” noting that the breach of $1.13 support represented a needed cleansing event before any meaningful upward movement could materialize.
The subsequent bounce has highlighted an emerging technical formation on the Relative Strength Index. Despite price action establishing a lower low, the RSI registered a higher low — creating a bullish divergence pattern that indicates weakening downside momentum.
Derivative Markets and ETF Activity Show Weakness
Futures Open Interest stood at an average of $2.96 billion at the beginning of June but has contracted to $2.45 billion. This contraction signals diminished participation from speculators and reflects waning conviction in an imminent upward move.
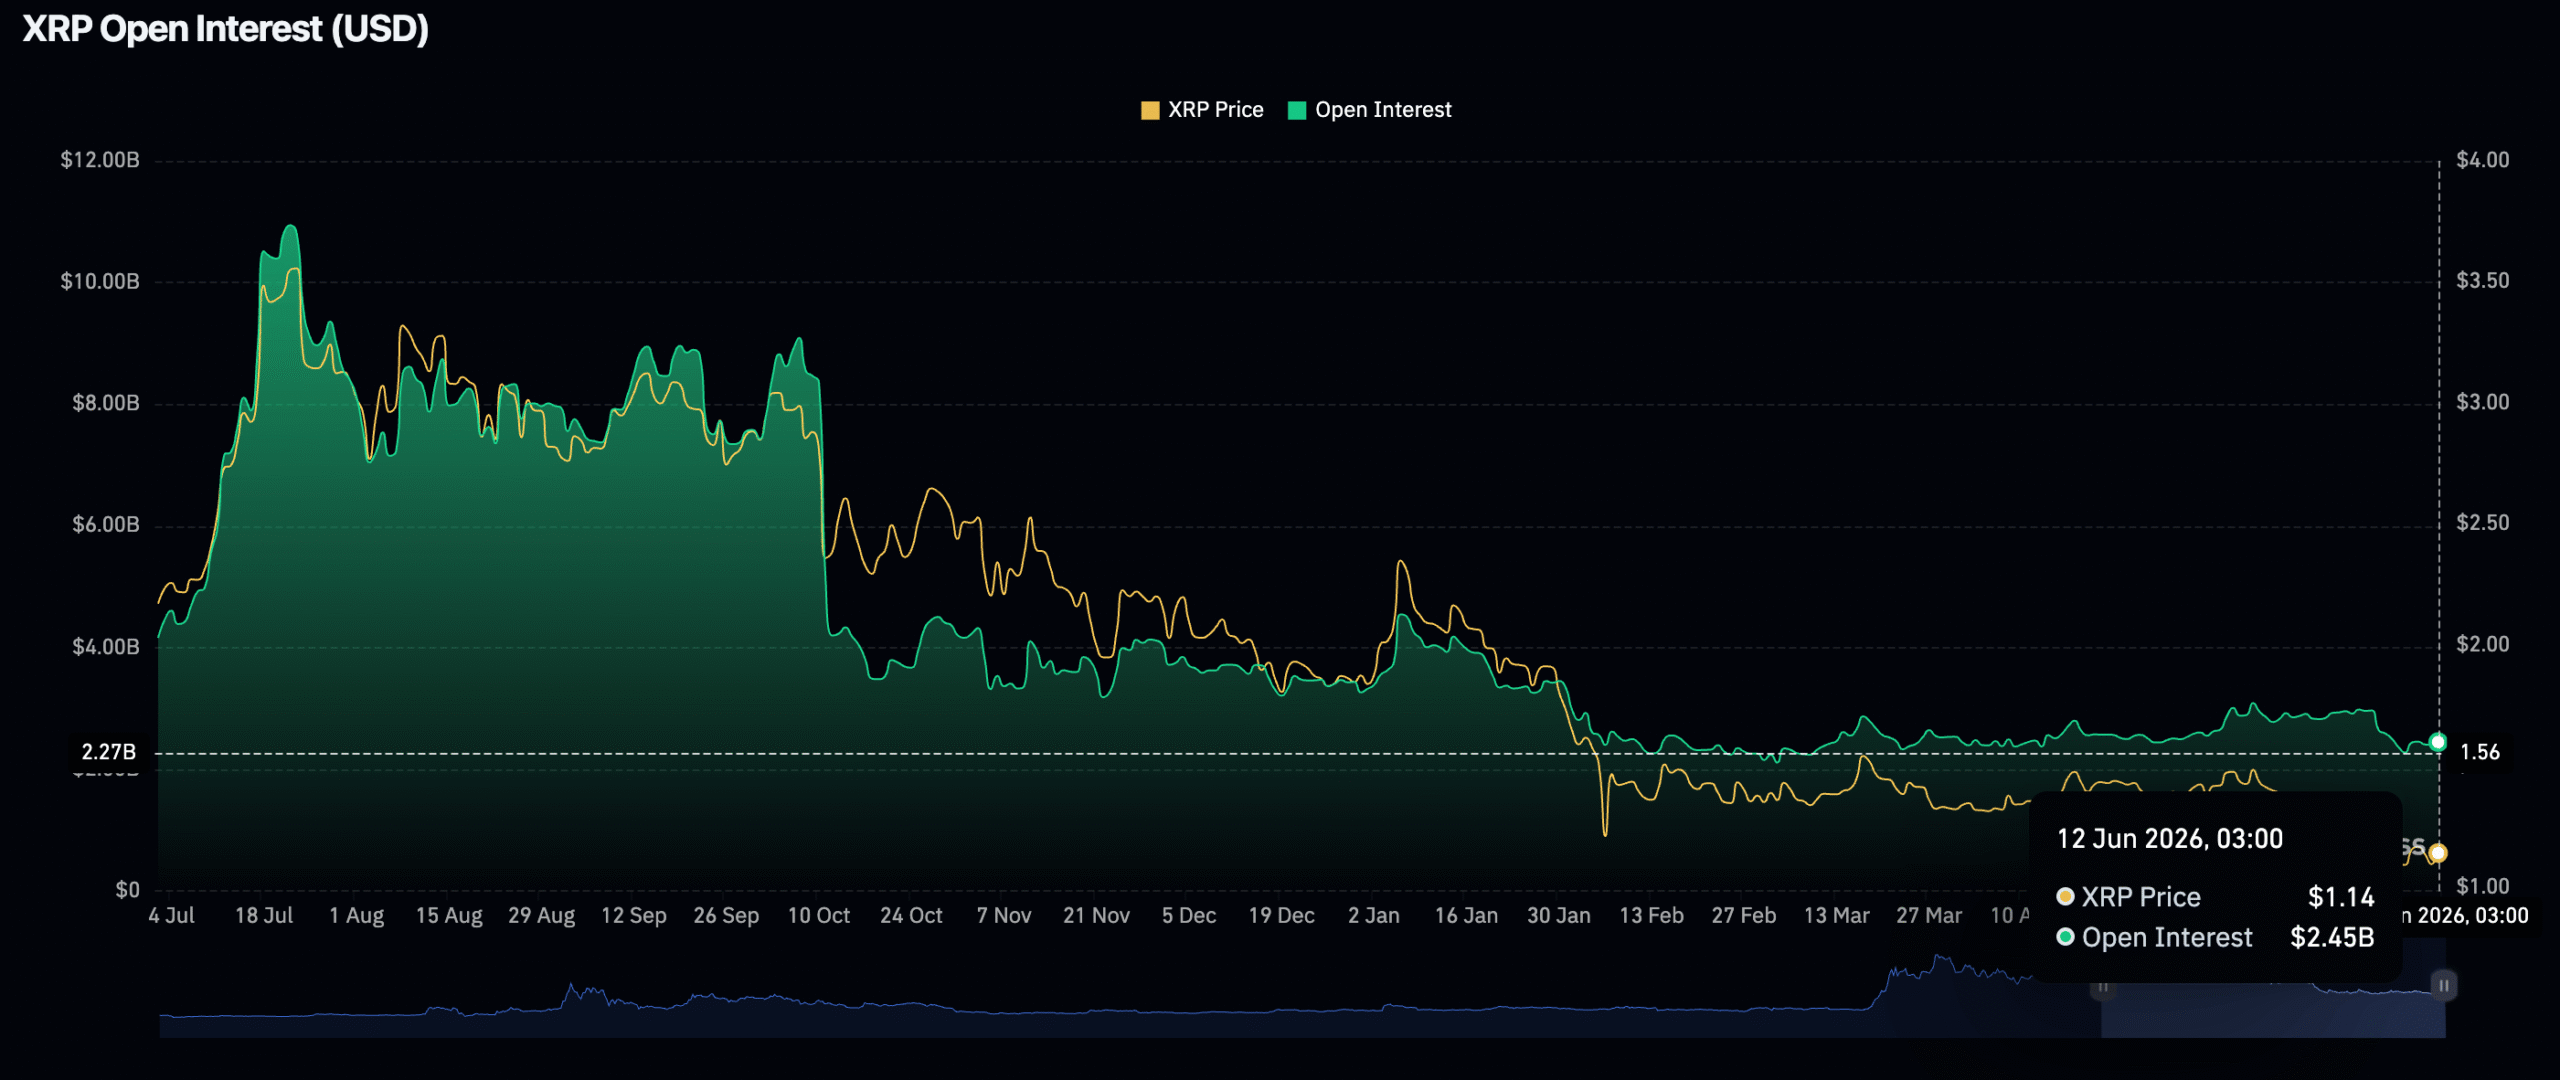 Source: Coinglass
Spot ETF activity for XRP has displayed irregular patterns. Capital inflows reached $7.44 million on Tuesday and $1.2 million on Wednesday, yet Thursday recorded zero movement. Total ETF inflows currently total $1.43 billion, while net assets under management sit at $985 million.
ChartNerd, a technical analyst, identified an important development on the bi-weekly timeframe. Price has retraced to the lower regression band of the Gaussian Channel around $1.04, a threshold that has emerged at comparable junctures during previous cycles. ChartNerd labeled this zone as “the land of macro opportunity” and noted this pattern has reliably repeated throughout earlier market phases.
Technical Resistance Levels Create Overhead Pressure
XRP continues to trade beneath its 10-day, 50-day, 100-day, and 200-day exponential moving averages. The 50-day EMA hovers around $1.30, coinciding with the significant resistance threshold that market participants are monitoring closely.
The 100-day EMA is positioned near $1.39, whereas the 200-day EMA rests around $1.61. These price points create an extensive overhead supply region that must be overcome for any durable uptrend to establish itself.
The RSI (14) currently registers 35.10, hovering above oversold conditions but moving closer to that threshold. The MACD indicator remains marginally negative at -0.06656. The Momentum (10) indicator has recently generated a Buy signal, potentially suggesting that near-term selling pressure is diminishing.
TradingView’s composite technical assessment stands at Neutral, incorporating 14 Sell indicators, 10 Neutral readings, and only 2 Buy signals.
From an Elliott Wave perspective, analysts suggest XRP could be finalizing a Wave (2) correction as part of a broader Cycle Wave V pattern. The identified accumulation range spans between the 50% and 61.8% Fibonacci retracement levels, approximately $1.19 to $0.91. Market technicians assign a 65-70% probability that the larger bullish framework remains valid.
At press time, XRP was trading around $1.14, reflecting a 3.06% gain over the preceding 24-hour period.
The post XRP (XRP) Bounces From $1.05 Low as Analysts Call Market Bottom and Target $1.30 Breakout appeared first on Blockonomi.


You May Also Like

US Households Have Never Been More Exposed to the Stock Market, And That’s a Problem

What Happens to Remittix Price When 2 Hidden CEX Names Drop at $32M?

Solana Gains Access to Hundreds of Tokenized Stocks and ETFs


