

XRP Is 44% Below Its 200 EMA — What Ripple Price Today Really Shows
The Ripple price today sits at $1.13, but the daily chart tells a different story. XRP has been grinding lower for weeks, caught between short-term calm and a deteriorating daily structure. Sellers remain in control, and the burden of proof sits on the bulls to reclaim lost ground.
However, the broader crypto market offers little comfort. Bitcoin dominance sits above 56%, meaning capital continues to concentrate in BTC at the expense of altcoins like XRP. Total crypto market cap is $2.24 trillion with a modest 24-hour gain of just 0.5%. The Fear & Greed Index registers a stark 12, deep in Extreme Fear territory. That is not a backdrop that typically seeds sustained altcoin recoveries.
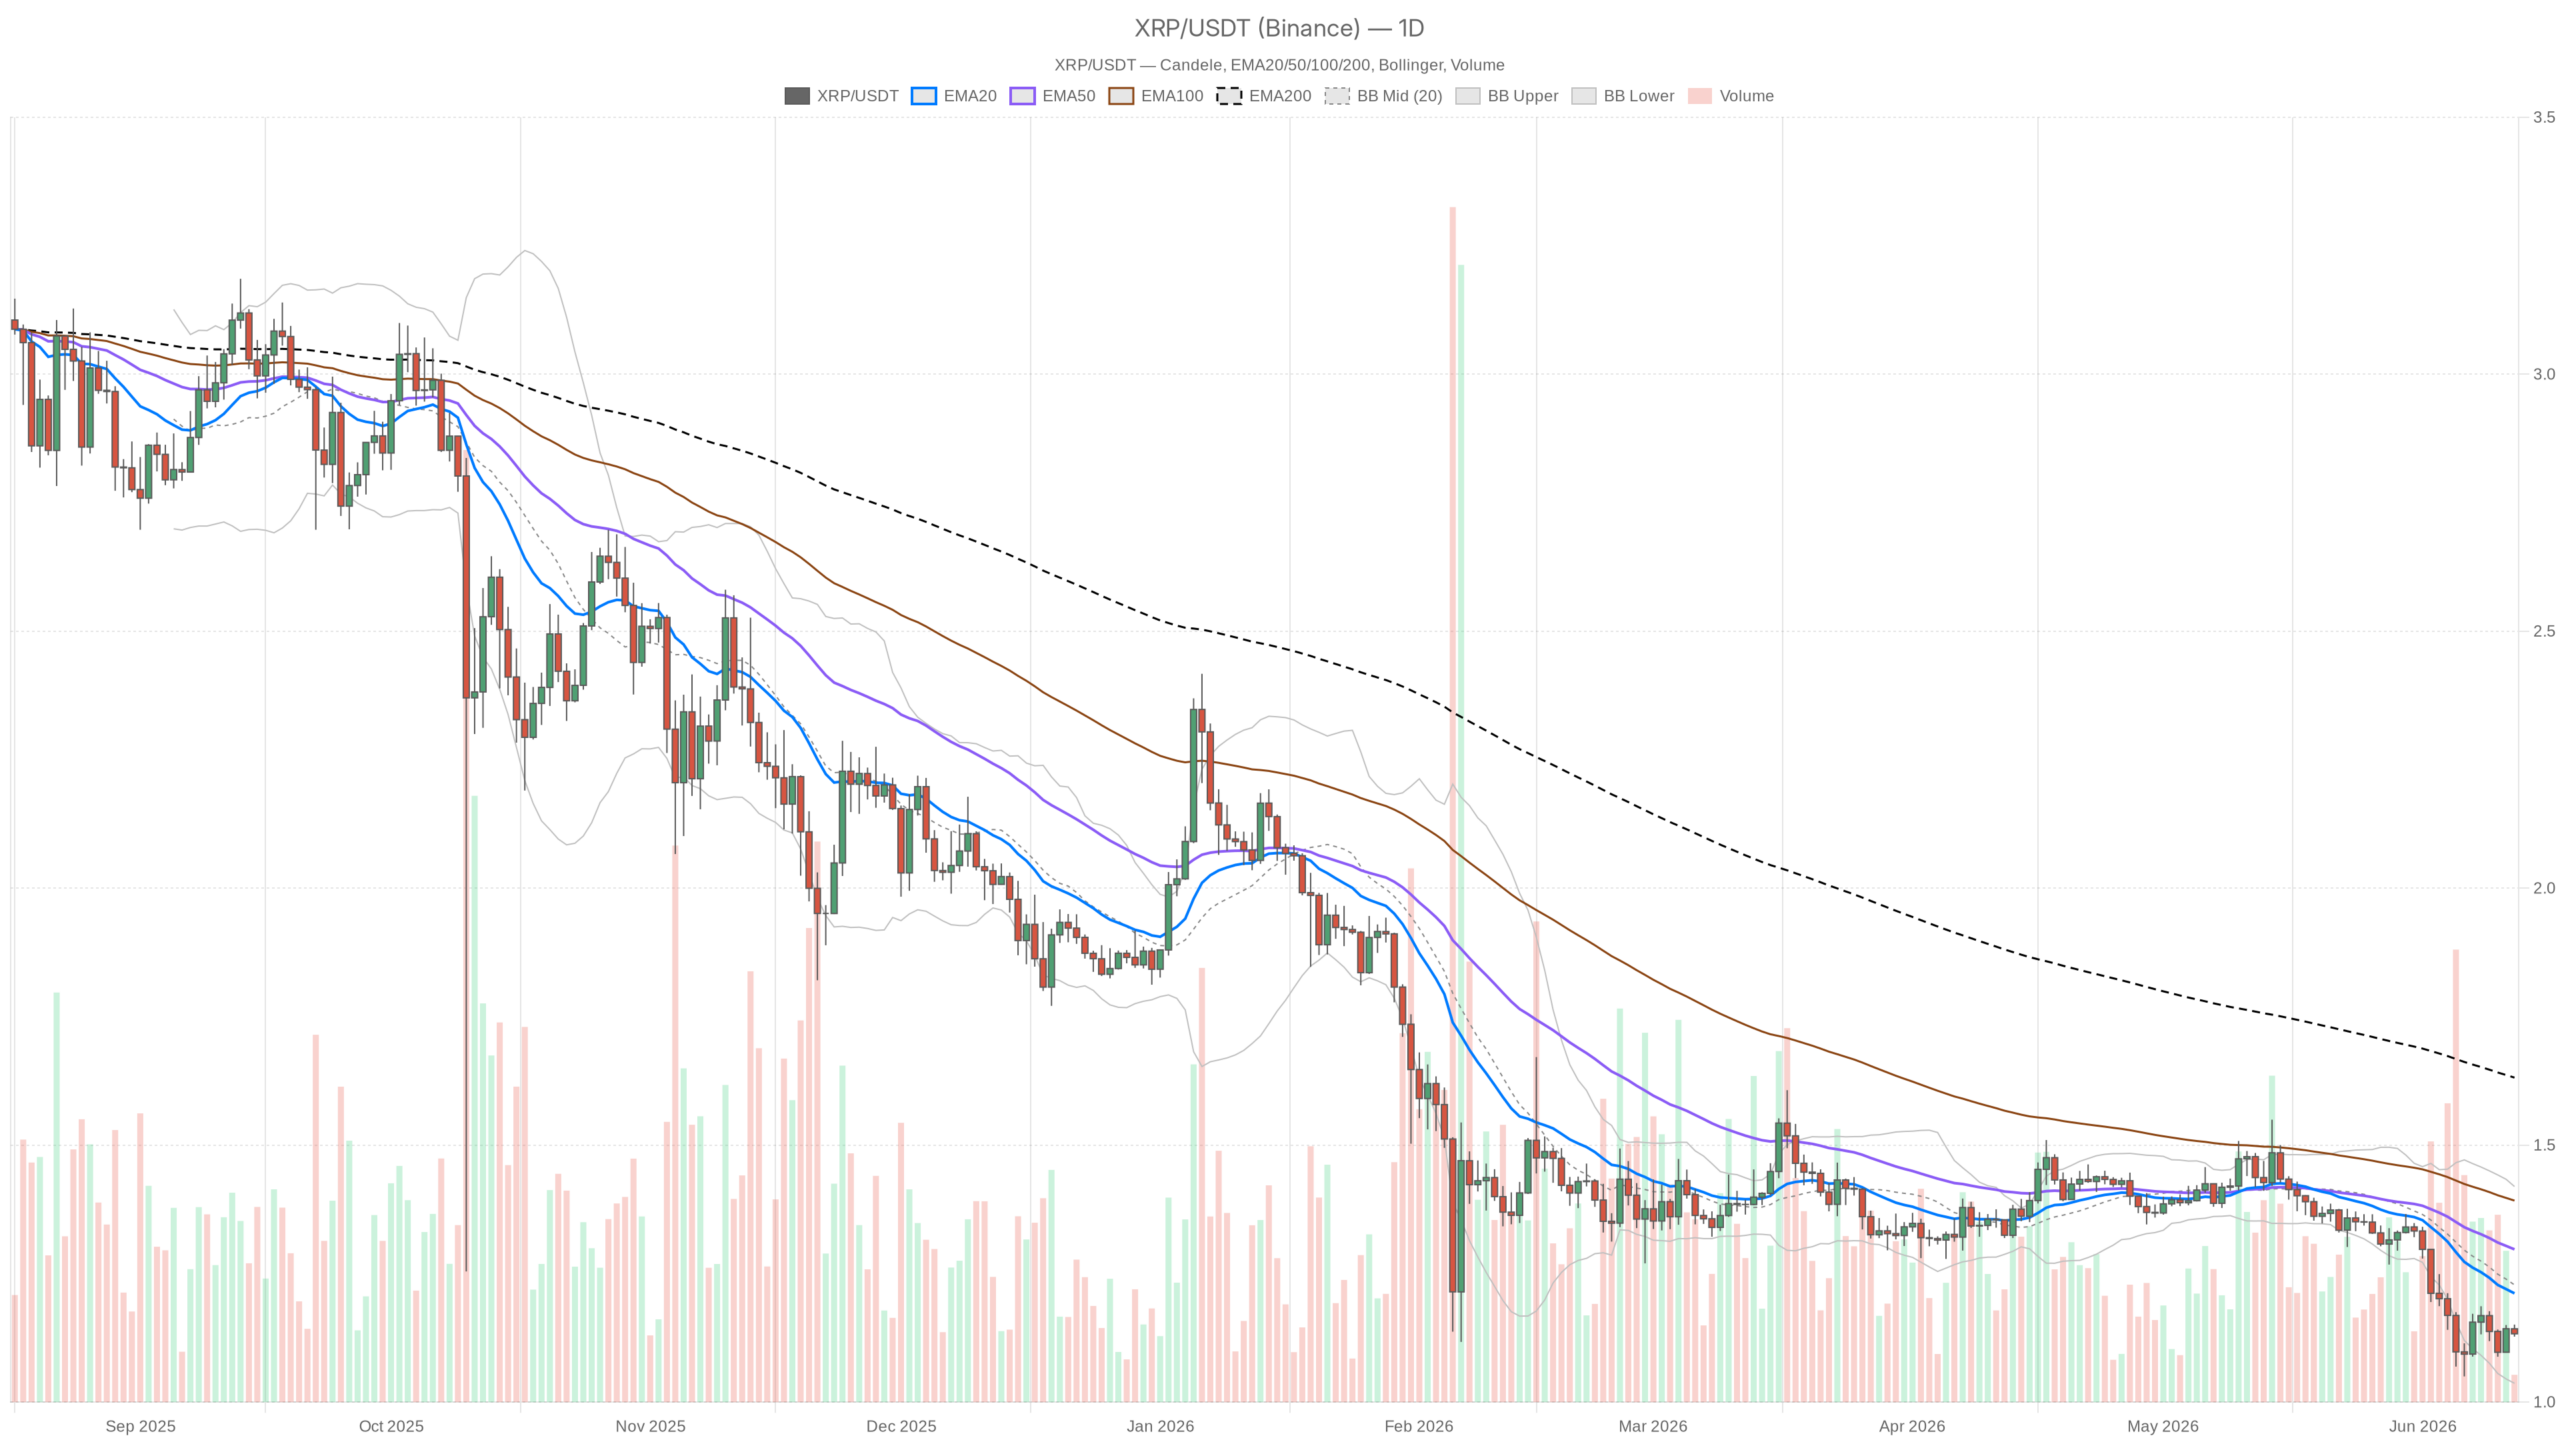 XRP/USDT — daily chart with candlesticks, EMA20/EMA50 and volume.
The Daily Chart: A Bear Market Structure in Plain Sight
On the D1 timeframe, the regime is unambiguously bearish. Price at $1.13 is trading below every major moving average that matters. The 20 EMA at $1.21, the 50 EMA at $1.30, and the 200 EMA at $1.63 form a full bearish stack. Each of those levels now represents overhead resistance rather than support.
The distance to the 200 EMA alone, roughly 44% above current price, underscores how much ground XRP has surrendered. There is no shortcut back to health from this configuration. It requires sustained buying pressure over weeks, not days.
The RSI at 35.2 on the daily is flirting with oversold territory without having crossed the line yet. That is the more dangerous zone — it suggests selling momentum has not completely exhausted itself. A reading below 30 would at least give contrarians a case for mean reversion. At 35, you are in no-man’s land.
The MACD reinforces this reading. Both the line and signal are negative, at -0.07 and -0.06 respectively. The histogram at -0.01 shows the gap between them is barely narrowing. Bearish momentum is decelerating, but it has not reversed.
Bollinger Bands on the daily place the midline at $1.23, a level XRP currently trades below. The lower band at $1.04 acts as the next meaningful technical reference to the downside. Price sitting in the lower half of the band confirms the bearish lean.
Moreover, the ATR of $0.06 sets the daily expected range in context. Moves of 5-6 cents in either direction fall well within normal volatility parameters. A bounce to $1.19 or a dip toward $1.07 could both occur without breaking any statistical norms.
Daily pivot analysis is tight and telling. The pivot point sits at $1.14, with R1 at $1.15 and S1 at $1.12. The proximity of these levels to current price reflects how compressed the market structure has become. A few cents either side determines the near-term direction signal.
The Hourly Chart: False Calm Before the Next Move
Zoom into the 1H and the picture looks almost tranquil by comparison. Price at $1.13 is sitting right on top of both the 20 and 50 EMA, also at $1.13. The RSI is at 50.98, exactly neutral. The MACD histogram is flat at zero. The Bollinger Band range spans $1.11 to $1.16. On the surface, this looks like equilibrium.
However, equilibrium at the bottom of a bearish daily structure is not a recovery. It is consolidation before the next leg plays out. The 200 EMA on the 1H at $1.15 is the key level to watch intraday. Price is trading below it, and any attempt to reclaim $1.15 will face this moving average as resistance. The daily bear trend has not been broken; the hourly is simply catching its breath.
The 15-Minute Timeframe: Zero Conviction Either Way
At the execution level, the 15-minute chart is essentially frozen. MACD line, signal, and histogram are all at zero. ATR is negligible. The EMAs at 1.13-1.14 are compressed. This is a market waiting for a catalyst. There is no scalping edge here in either direction, and anyone trying to trade the 15-minute noise is playing a coin flip.
The Bull Case: What Would Actually Change the Narrative
For XRP bulls, the scenario that matters starts with a clean reclaim of $1.15 on the 1H chart. That clears the 1H 200 EMA and shifts that timeframe from neutral toward bullish. Above that, $1.21 becomes the real test: the daily 20 EMA. A daily close above $1.21 would mark the first meaningful structural improvement in weeks and could attract momentum buyers looking for a bounce toward the $1.30 50 EMA zone.
Additionally, the Bollinger Band midline at $1.23 would come into play as a recovery target. This scenario becomes increasingly credible if BTC stabilizes and the Fear & Greed Index starts climbing back toward neutral territory. That would reduce the capital flight out of altcoins. Invalidation of the bullish case: a daily close below $1.04, breaching the lower Bollinger Band and opening the door to technically uncharted near-term lows.
The Bear Case: The Path of Least Resistance
The bearish scenario does not require much imagination. It is simply the continuation of the existing trend. A failure to reclaim $1.14-$1.15 in the coming sessions, combined with any deterioration in broader market sentiment, sets up a test of S1 at $1.12 and, more critically, the lower Bollinger Band at $1.04.
Meanwhile, the daily RSI at 35.2 still has not reached a washout level. There is room for further deterioration before a capitulation low establishes itself. In an Extreme Fear environment with BTC dominance elevated, altcoin selling pressure can persist longer than most traders expect. Invalidation of the bearish case: a decisive daily close above $1.21 with expanding volume, confirming buyers are absorbing supply.
Positioning and Risk Context
The Ripple price today reflects a market where the daily structure demands respect. XRP right now is a coin for patient watchers, not aggressive traders. This is not a dip to buy without confirmation, and the compressed intraday ranges offer poor reward-to-risk for fresh entries.
The interesting entry window for bulls is a reclaim of $1.15-$1.21 with follow-through. Trading the bounce before that confirmation has historically been expensive in trending bear markets. For those already positioned long from lower levels, $1.04 is the logical line in the sand. A break there with daily closes below shifts the framework entirely.
Ultimately, volatility is low right now by ATR standards, but that often precedes an expansion. With the Fear & Greed Index at 12, market conditions remain fragile. Liquidity can evaporate quickly in either direction. Whatever happens next, position sizing and defined exit levels are non-negotiable. The market rarely rewards conviction without clarity, and right now, clarity belongs to the bears until proven otherwise.


You May Also Like

3 Reasons Investors Are Following Mutuum Finance (MUTM) Since Q1 2025

SpaceX (SPCX) Began Trading, but Binance and Other Major Cryptocurrency Exchanges Were Forced to Issue Statements One After Another

Fed Governor Calls For Strong Stablecoin Oversight As CLARITY Act’s Final Text Gets Delayed


