

Anchorage Warns Bitcoin Yield Trade Could Cap Gains If BTC Rips Higher
Anchorage Digital says Bitcoin covered-call strategies can generate synthetic yield for BTC holders, but only when managed with strict discipline. The firm’s new research warns that selling upside on Bitcoin can cushion drawdowns in weaker markets, yet cap gains sharply when BTC enters one of its violent bull-market phases.
The analysis, written by Anchorage Digital Head of Research David Lawant, examines systematic covered-call writing on Bitcoin using hourly simulations across the Deribit implied-volatility surface. Anchorage said the study includes more than 37,000 individual backtests across every possible entry point in its October 2021 to April 2026 dataset, making it one of the more detailed attempts to define where BTC options income works and where it breaks.
Anchorage Puts Bitcoin Yield Strategy To The Test
Anchorage argues that Bitcoin options have moved from a niche derivatives segment into an institutionally relevant market. Notional BTC options open interest has grown roughly ten-fold over the past five years, briefly rising above $100 billion at the end of 2025 before sitting around $60 billion in the study. That level, the paper notes, is above the open interest of the entire BTC futures market.
IBIT options have also changed the structure of the market. Launched in late 2024, they have grown quickly enough to rival Deribit as a leading venue for BTC options open interest and trading activity. For Anchorage, that means the market institutions are evaluating today is deeper, more accessible and materially different from the one that existed 18 months earlier.
The research centers on Bitcoin’s volatility risk premium. Anchorage compares 25-delta call implied volatility with subsequent realized upside volatility over the next 21 trading days for BTC, SPY and QQQ. BTC’s upside volatility risk premium, according to the paper, has averaged roughly two to three times what the equity benchmarks delivered, with the gap persisting for most of the post-2024 period.
That premium is the attraction. Covered calls allow BTC holders to collect option income while keeping exposure to the underlying asset up to a defined strike. The cost is just as important: if Bitcoin rallies through the strike, upside participation is capped. Anchorage frames this as the central tension in the strategy, not a footnote. A simple 20-delta, 30-day covered-call strategy performed well in the most recent 12-month window tested.
From April 30, 2025 to April 30, 2026, it generated a net yield of 5.5% on the underlying BTC position while spot BTC fell 19.4%. In Anchorage’s simulation, the overlay offset almost a third of the BTC drawdown. The blended portfolio’s annualized volatility also fell from 40.6% to 35.0%, while maximum drawdown improved from 49.7% to 44.5%.
But the full-cycle results were much less flattering. When the same unfiltered strategy was extended across the entire October 2021 to April 2026 period, it produced a negative yield of 0.5%, or minus 0.1% annualized. That happened despite a favorable win/loss ratio of 4.38 to 1, with 57 winning trades against 13 losing ones.
Anchorage describes the problem as “picking up pennies in front of a steamroller.” The steamroller is Bitcoin’s tendency to stage sustained, autocorrelated rallies. During the late 2021 cycle peak, the 2023–2024 move from roughly $16,000 to more than $70,000, and the 2025 bull market that briefly pushed BTC above $100,000, short calls were repeatedly overrun as spot moved through strike prices.
That is why the paper argues covered-call writing is an “active management strategy,” not a passive yield overlay. The unfiltered version sold calls regardless of regime. The disciplined version waited for better conditions.
Anchorage tested a filter requiring BTC’s trend not to be strongly bullish, based on a 10-day, 30-day and 50-day moving-average stack, and requiring implied volatility to sit above its 90-day rolling average. On exit, the model used a 75% take-profit threshold, a delta stop-loss and a two-day buffer before expiry to reduce gamma risk.
The results changed materially. With those simple regime and implied-volatility filters, the covered-call contribution rose to 23.7% over the full period, or 5.2% annualized. The blended portfolio Sharpe improved from 0.20 to 0.30, but the strategy was in the market only 44% of the time.
Anchorage’s parameter work also narrows the viable range. Deltas below 10 were consistent but too thin for many institutional mandates. Above 25-delta, directional exposure overwhelmed the strategy during BTC bull markets. Seven-day and 14-day expiries were structurally disadvantaged because BTC’s intraday volatility created stop-loss events before theta decay could do enough work. The paper identifies the productive corridor as 10- to 25-delta calls with expiries of at least 21 days.
The strongest evidence came from the rolling-window analysis. At the one-year horizon, positive-yield rates across the productive corridor ranged from roughly 55% to 85%, showing meaningful regime sensitivity. At the three-year horizon, eleven of twelve configurations produced positive yield in at least 91% of rolling windows, with five reaching 100%. Median annualized yields clustered between 4% and 6%.
For BTC investors, the takeaway is not that covered calls are broken. It is that the strategy is highly path-dependent. In slow or falling markets, it can generate meaningful income. In powerful upside regimes, the same trade can leave holders watching Bitcoin rally while their upside has already been sold.
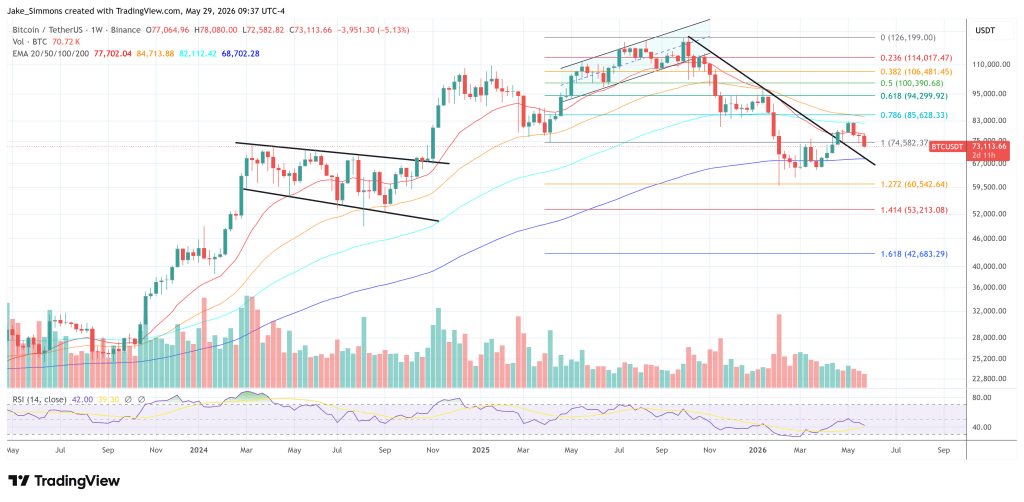
At press time, BTC traded at $73,113.


You May Also Like

PMI-ACP Exam Preparation: How to Use a Simulator and Practice Questions Effectively

EUR/GBP Exchange Rate Surges as Bank of England Rate Hike Expectations Intensify – Market Analysis

What Is Redactle? How to Play the Wikipedia Puzzle Game



