Bitcoin’s recent rally, fueled by renewed optimism over a U.S.-Iran deal, has been interpreted as a credible first-order macro signal. However, the move still requiresBitcoin’s recent rally, fueled by renewed optimism over a U.S.-Iran deal, has been interpreted as a credible first-order macro signal. However, the move still requires

Bitcoin Iran-Deal Rally Tests Oil Flows and Fed Pricing

For feedback or concerns regarding this content, please contact us at crypto.news@mexc.com

Bitcoin’s recent rally, fueled by renewed optimism over a U.S.-Iran deal, has been interpreted as a credible first-order macro signal. However, the move still requires confirmation from physical oil flows, gasoline prices, inflation compensation, and Federal Reserve pricing before traders can treat it as a reliable path to rate cuts.

Market Logic and Immediate Impact

The immediate market logic seemed straightforward. A reported framework could potentially extend a ceasefire for 60 days, reopen the Strait of Hormuz, allow Iranian oil sales through sanctions waivers, and move nuclear concessions into follow-on negotiations. If that sequence holds, the war premium in crude can fall, easing gasoline pressure, cooling inflation readings, softening Treasury yields, and allowing Bitcoin to trade less like an asset trapped under real-rate pressure. The bounce on May 25 saw BTC trading between $77,400 and $77,500, still far below its October 2025 high of $126,198. In this context, any signal pulling the market away from higher oil prices and tougher Fed policy can trigger an outsized relief move. The stronger interpretation is that markets are paying upfront for a deal whose value depends on as-yet-unsettled facts: physical shipping through the Hormuz Strait, oil and LNG flows, gasoline pass-through, inflation compensation, Fed communication, and durable nuclear limits.

Oil as the First Test

The fastest transmission channel from the reported deal to Bitcoin runs through crude. Global shares mostly rose while WTI crude fell $4.77 to $91.83 and Brent fell $4.86 to $98.68 after President Donald Trump said Iran talks were progressing. U.S. markets were closed for Memorial Day, so the move is best read as a global-market and oil-futures reaction rather than a full U.S. risk-asset close. Even with that caveat, the direction was clear: lower oil, less immediate inflation pressure, and more room for risk assets to recover. A similar outline described a gradual reopening of the waterway, sanctions waivers for oil sales, and unresolved details around enrichment and nuclear material. For Bitcoin, the oil channel is central to the trade. The asset has spent much of the Iran war period behaving like a liquidity-sensitive risk asset, under pressure from higher energy costs and tighter Fed pricing. A credible reduction in the oil shock can support crypto by lowering the probability that policymakers need to keep policy restrictive for longer.

Hormuz Relief Needs Physical Normalization

The physical energy backdrop remains large enough that a diplomatic outline still has to become a functioning oil market. The International Energy Agency said Gulf output affected by the Hormuz closure was 14.4 million barrels per day below pre-war levels, while observed global inventories drew by about 250 million barrels over March and April. The U.S. Energy Information Administration’s data showed oil flows through the Strait of Hormuz falling from 20.7 million barrels per day in the fourth quarter of 2025 to 14.6 million in the first quarter of 2026. LNG flows fell from 10.1 billion cubic feet per day to 7.3 billion over the same period. Those numbers explain why reopening Hormuz would register immediately across risk assets. They also show the scale of the implementation gap. Oil and LNG flows, Gulf production, and inventories have to move back toward normal before lower futures prices become a durable disinflation signal.

Fed Rate-Cut Path and Bitcoin’s Rally

Bitcoin is rallying because de-escalation can change the rate conversation through energy prices. A cooler energy market can pull inflation readings and inflation compensation away from the worst Iran-war scenarios, making the Fed less likely to delay cuts further or keep the risk of a hike alive. The April inflation data explained the sensitivity. CPI rose 0.6% month over month and 3.8% year over year, while energy rose 17.9% and gasoline jumped 28.4% over 12 months. That pass-through turns foreign-policy shocks into domestic rate pressure. The Fed’s April statement held the federal funds target range at 3.50% to 3.75% and cited elevated inflation partly reflecting global energy prices. Minutes from the April meeting said expected cuts had shifted later into the third and fourth quarters of 2026 and the first quarter of 2027, while options pricing implied about a 30% probability of a rate hike by the first quarter of 2027. A U.S.-Iran deal can reverse that pressure only if it changes the inflation data and market-implied inflation path. Lower crude futures help. Lower gasoline prices help more.

Nuclear Limits and Durability

The political fight over whether the reported framework is stronger than the Obama-era JCPOA has a direct market consequence: the durability of the oil-risk premium. The reported framework could be stronger if Iran verifiably gives up roughly 440.9 kilograms of uranium enriched up to 60%. This would directly address a near-weapons-grade stockpile. However, if enrichment suspension, long-term caps, verification access, duration, and Fordow restrictions remain open or absent, the market lacks a firm basis for saying the new framework has removed the risk that pushed oil higher.

The Data Test Ahead

The bullish version is easy to map. Tankers return, Iranian oil sales add supply, Brent and WTI keep falling, gasoline prices follow, and breakeven inflation cools. In that world, Bitcoin’s rebound can become more than a geopolitical headline trade. The bearish version requires only enough unresolved risk for energy markets to keep pricing disruption. If Hormuz flows remain impaired or gasoline stays high, the Fed and midterm voters face much the same inflation problem under a calmer label. Traders would overreach if they treated a reported political framework as already equivalent to disinflation. The rally becomes a durable macro off-ramp when the deal shows up in barrels, cargoes, gas stations, inflation compensation, and Fed pricing before November 2026. Until then, the Bitcoin Iran-deal rally is a rational relief trade waiting for proof in the data.

The post Bitcoin Iran-Deal Rally Tests Oil Flows and Fed Pricing appeared first on TheCryptoUpdates.


Market Opportunity
Orderly Network Logo
Orderly Network Price(ORDER)
$0.0517
$0.0517$0.0517
-3.18%
USD
Orderly Network (ORDER) Live Price Chart

AI Strategy: Powered 24/7

AI Strategy: Powered 24/7AI Strategy: Powered 24/7

Generate automated strategies using natural language

Disclaimer: The articles reposted on this site are sourced from public platforms and are provided for informational purposes only. They do not necessarily reflect the views of MEXC. All rights remain with the original authors. If you believe any content infringes on third-party rights, please contact crypto.news@mexc.com for removal. MEXC makes no guarantees regarding the accuracy, completeness, or timeliness of the content and is not responsible for any actions taken based on the information provided. The content does not constitute financial, legal, or other professional advice, nor should it be considered a recommendation or endorsement by MEXC.

You May Also Like

Ethereum koers toont zeldzaam dubbel koopsignaal en richt zich op $4.550

Ethereum koers toont zeldzaam dubbel koopsignaal en richt zich op $4.550

Connect met Like-minded Crypto Enthusiasts! Connect op Discord! Check onze Discord   Ethereum laat op de uurgrafiek twee opeenvolgende TD Sequential koopsignalen zien. Deze indicator meet uitputting in een trend en geeft vaak een signaal dat de verkoopdruk kan afnemen. Dit dubbele signaal verschijnt rond het niveau van $4.516, waar de ETH prijs kortstondig steun vindt. Dit type formatie komt zelden voor en wordt daarom extra nauwlettend gevolgd. Wat gaat de Ethereum koers hiermee doen? Ethereum koers test steun rond $4.516 De scherpe daling van de Ethereum koers vanaf de prijszone rond $4.800 bracht de ETH prijs in korte tijd naar ongeveer $4.516. Op dit niveau trad duidelijke koopactiviteit op, waardoor de neerwaartse beweging tijdelijk werd gestopt. Het dubbele signaal dat door de TD Sequential indicator is gegenereerd, viel precies samen met dit prijspunt. De TD Sequential is opgebouwd uit negen candles die een trend meetellen. Wanneer de negende candle verschijnt, kan dit duiden op een trendomslag. In dit geval verschenen zelfs twee signalen kort na elkaar, wat aangeeft dat de verkoopdruk mogelijk uitgeput is. Het feit dat dit gebeurde in een zone waar ETH kopers actief bleven, maakt het patroon extra opvallend. TD Sequential just flashed two buy signals for Ethereum $ETH! pic.twitter.com/JPO8EhiEPi — Ali (@ali_charts) September 16, 2025 Welke crypto nu kopen?Lees onze uitgebreide gids en leer welke crypto nu kopen verstandig kan zijn! Welke crypto nu kopen? Fed-voorzitter Jerome Powell heeft aangekondigd dat de rentes binnenkort zomaar eens omlaag zouden kunnen gaan, en tegelijkertijd blijft BlackRock volop crypto kopen, en dus lijkt de markt klaar om te gaan stijgen. Eén vraag komt telkens terug: welke crypto moet je nu kopen? In dit artikel bespreken we de munten die… Continue reading Ethereum koers toont zeldzaam dubbel koopsignaal en richt zich op $4.550 document.addEventListener('DOMContentLoaded', function() { var screenWidth = window.innerWidth; var excerpts = document.querySelectorAll('.lees-ook-description'); excerpts.forEach(function(description) { var excerpt = description.getAttribute('data-description'); var wordLimit = screenWidth wordLimit) { var trimmedDescription = excerpt.split(' ').slice(0, wordLimit).join(' ') + '...'; description.textContent = trimmedDescription; } }); }); Technische indicatoren schetsen herstelkans voor ETH Naast de dubbele koopsignalen verstrekken ook andere indicatoren belangrijke aanwijzingen. Tijdens de daling van de ETH koers waren grote rode candles zichtbaar, maar na de test van $4.516 stabiliseerde de Ethereum koers. Dit wijst op een mogelijke verschuiving in het evenwicht tussen de bears en bulls. Als deze opwaartse beweging doorzet, liggen de eerste weerstanden rond $4.550. Daarboven wacht een sterkere zone rond $4.650. Deze niveaus zijn in eerdere Ethereum sessies al meerdere keren getest. Een doorbraak zou ruimte openen richting de all-time high van ETH rond $4.953. Wanneer de prijs toch opnieuw onder $4.516 zakt, liggen er zones rond $4.500 en $4.450 waar grotere kooporders worden verwacht. Deze niveaus kunnen als een vangnet fungeren, mocht de druk opnieuw toenemen. Marktdynamiek bevestigt technische indicatoren De huidige situatie volgt op een bredere correctie in de cryptomarkt. Verschillende vooraanstaande crypto tokens zagen scherpe koersdalingen, waarna traders op zoek gingen naar signalen voor een mogelijke ommekeer. Dat juist Ethereum nu een dubbel TD Sequential signaal toont, versterkt de interesse in dit scenario. Fundamenteel blijft Ethereum sterk. Het aantal ETH tokens dat via staking is vastgezet, blijft groeien. Dat verkleint de vrije circulatie en vermindert verkoopdruk. Tegelijk blijft het netwerk intensief gebruikt voor DeFi, NFT’s en stablecoins. Deze activiteiten zorgen voor een stabiele vraag naar ETH, ook wanneer de prijs tijdelijk onder druk staat. Fundamentele drijfveren achter de Ethereum koers De Ethereum koers wordt echter niet alleen bepaald door candles en patronen, maar ook door bredere factoren. Een stijgend percentage van de totale ETH supply staat vast in staking contracten. Hierdoor neemt de liquiditeit op exchanges af. Dit kan prijsschommelingen versterken wanneer er plotseling meer koopdruk ontstaat. Daarnaast is Ethereum nog steeds het grootste smart contract platform. Nieuwe standaarden zoals ERC-8004 en ontwikkelingen rond layer-2 oplossingen houden de activiteit hoog. Deze technologische vooruitgang kan de waardepropositie ondersteunen en zo indirect bijdragen aan een ETH prijsherstel. Het belang van de korte termijn dynamiek De komende handelsdagen zullen duidelijk maken of de bulls genoeg kracht hebben om door de weerstandszone rond $4.550 te breken. Voor de bears ligt de focus juist op het verdedigen van de prijsregio rond $4.516. De whales, die met grote handelsorders opereren, kunnen hierin een beslissende rol spelen. Het dubbele TD Sequential signaal blijft hoe dan ook een zeldzame gebeurtenis. Voor cryptoanalisten vormt het een objectief aanknopingspunt om de kracht van de huidige Ethereum trend te toetsen. Vooruitblik op de ETH koers Ethereum liet twee opeenvolgende TD Sequential signalen zien op de uurgrafiek, iets wat zelden voorkomt. Deze formatie viel samen met steun rond $4.516, waar de bulls actief werden. Als de Ethereum koers boven dit niveau blijft, kan er ruimte ontstaan richting $4.550 en mogelijk $4.650. Zakt de prijs toch opnieuw onder $4.516, dan komen $4.500 en $4.450 in beeld als nieuwe steunzones. De combinatie van zeldzame indicatoren en een sterke fundamentele basis maakt Ethereum interessant voor zowel technische als fundamentele analyses. Of de bulls het momentum echt kunnen overnemen, zal blijken zodra de Ethereum koers de eerstvolgende weerstanden opnieuw test. Koop je crypto via Best Wallet Best wallet is een topklasse crypto wallet waarmee je anoniem crypto kan kopen. Met meer dan 60 chains gesupport kan je al je main crypto coins aanschaffen via Best Wallet. Best wallet - betrouwbare en anonieme wallet Best wallet - betrouwbare en anonieme wallet Meer dan 60 chains beschikbaar voor alle crypto Vroege toegang tot nieuwe projecten Hoge staking belongingen Lage transactiekosten Best wallet review Koop nu via Best Wallet Let op: cryptocurrency is een zeer volatiele en ongereguleerde investering. Doe je eigen onderzoek. Het bericht Ethereum koers toont zeldzaam dubbel koopsignaal en richt zich op $4.550 is geschreven door Dirk van Haaster en verscheen als eerst op Bitcoinmagazine.nl.
Share
Coinstats2025/09/17 23:31
Binance Perpetual Futures Revolution: QQQ and Major US Stocks Enter Crypto Derivatives Market with 10x Leverage
Binance Perpetual Futures Revolution: QQQ and Major US Stocks Enter Crypto Derivatives Market with 10x Leverage

BitcoinWorld Binance Perpetual Futures Revolution: QQQ and Major US Stocks Enter Crypto Derivatives Market with 10x Leverage In a groundbreaking move that bridges
Share
bitcoinworld2026/04/02 18:00
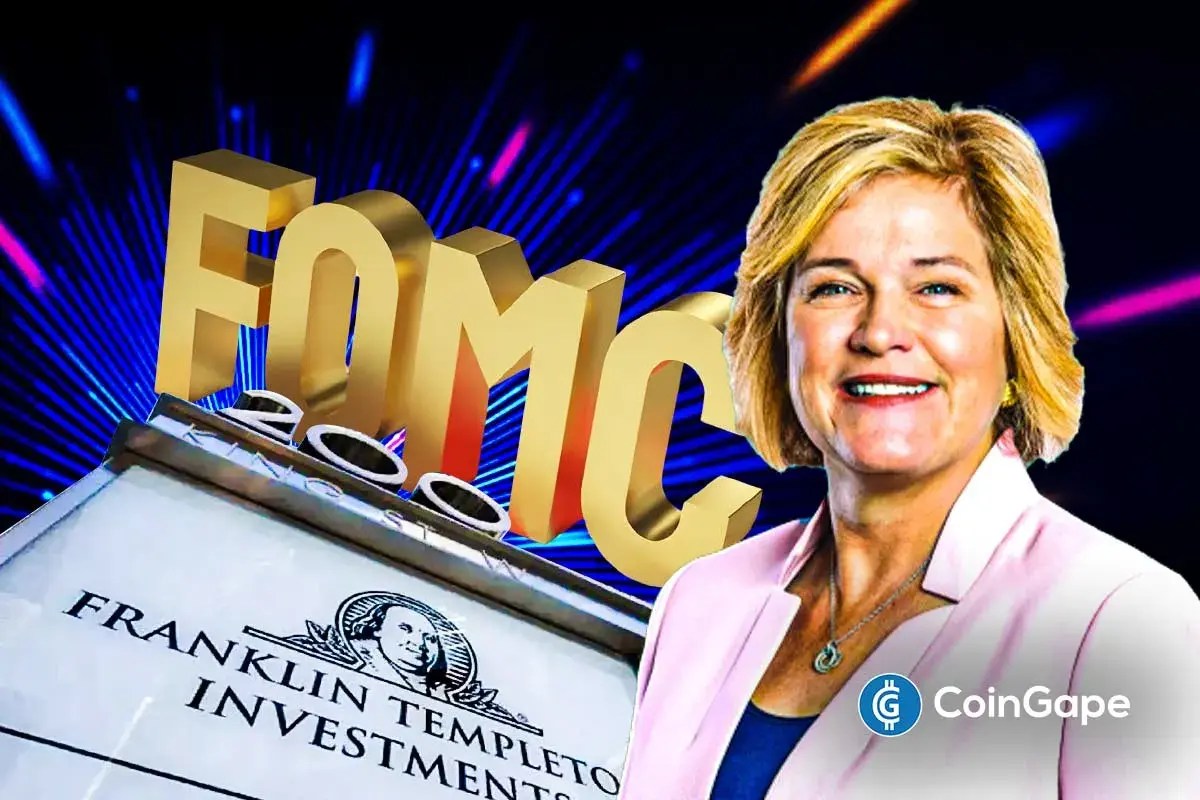
Franklin Templeton CEO Dismisses 50bps Rate Cut Ahead FOMC

Franklin Templeton CEO Dismisses 50bps Rate Cut Ahead FOMC

The post Franklin Templeton CEO Dismisses 50bps Rate Cut Ahead FOMC appeared on BitcoinEthereumNews.com. Franklin Templeton CEO Jenny Johnson has weighed in on whether the Federal Reserve should make a 25 basis points (bps) Fed rate cut or 50 bps cut. This comes ahead of the Fed decision today at today’s FOMC meeting, with the market pricing in a 25 bps cut. Bitcoin and the broader crypto market are currently trading flat ahead of the rate cut decision. Franklin Templeton CEO Weighs In On Potential FOMC Decision In a CNBC interview, Jenny Johnson said that she expects the Fed to make a 25 bps cut today instead of a 50 bps cut. She acknowledged the jobs data, which suggested that the labor market is weakening. However, she noted that this data is backward-looking, indicating that it doesn’t show the current state of the economy. She alluded to the wage growth, which she remarked is an indication of a robust labor market. She added that retail sales are up and that consumers are still spending, despite inflation being sticky at 3%, which makes a case for why the FOMC should opt against a 50-basis-point Fed rate cut. In line with this, the Franklin Templeton CEO said that she would go with a 25 bps rate cut if she were Jerome Powell. She remarked that the Fed still has the October and December FOMC meetings to make further cuts if the incoming data warrants it. Johnson also asserted that the data show a robust economy. However, she noted that there can’t be an argument for no Fed rate cut since Powell already signaled at Jackson Hole that they were likely to lower interest rates at this meeting due to concerns over a weakening labor market. Notably, her comment comes as experts argue for both sides on why the Fed should make a 25 bps cut or…

Share
BitcoinEthereumNews2025/09/18 00:36

No Chart Skills? Still Profit

No Chart Skills? Still ProfitNo Chart Skills? Still Profit

Copy top traders in 3s with auto trading!