

Apple Stock Stalls Below $300 as Hourly Momentum Cools
Apple Stock remains in a firm daily uptrend just beneath the $300 handle, while hourly momentum cools. The daily bias is still bullish; however, near‑term conditions argue for a pause or shallow pullback before any decisive breakout.
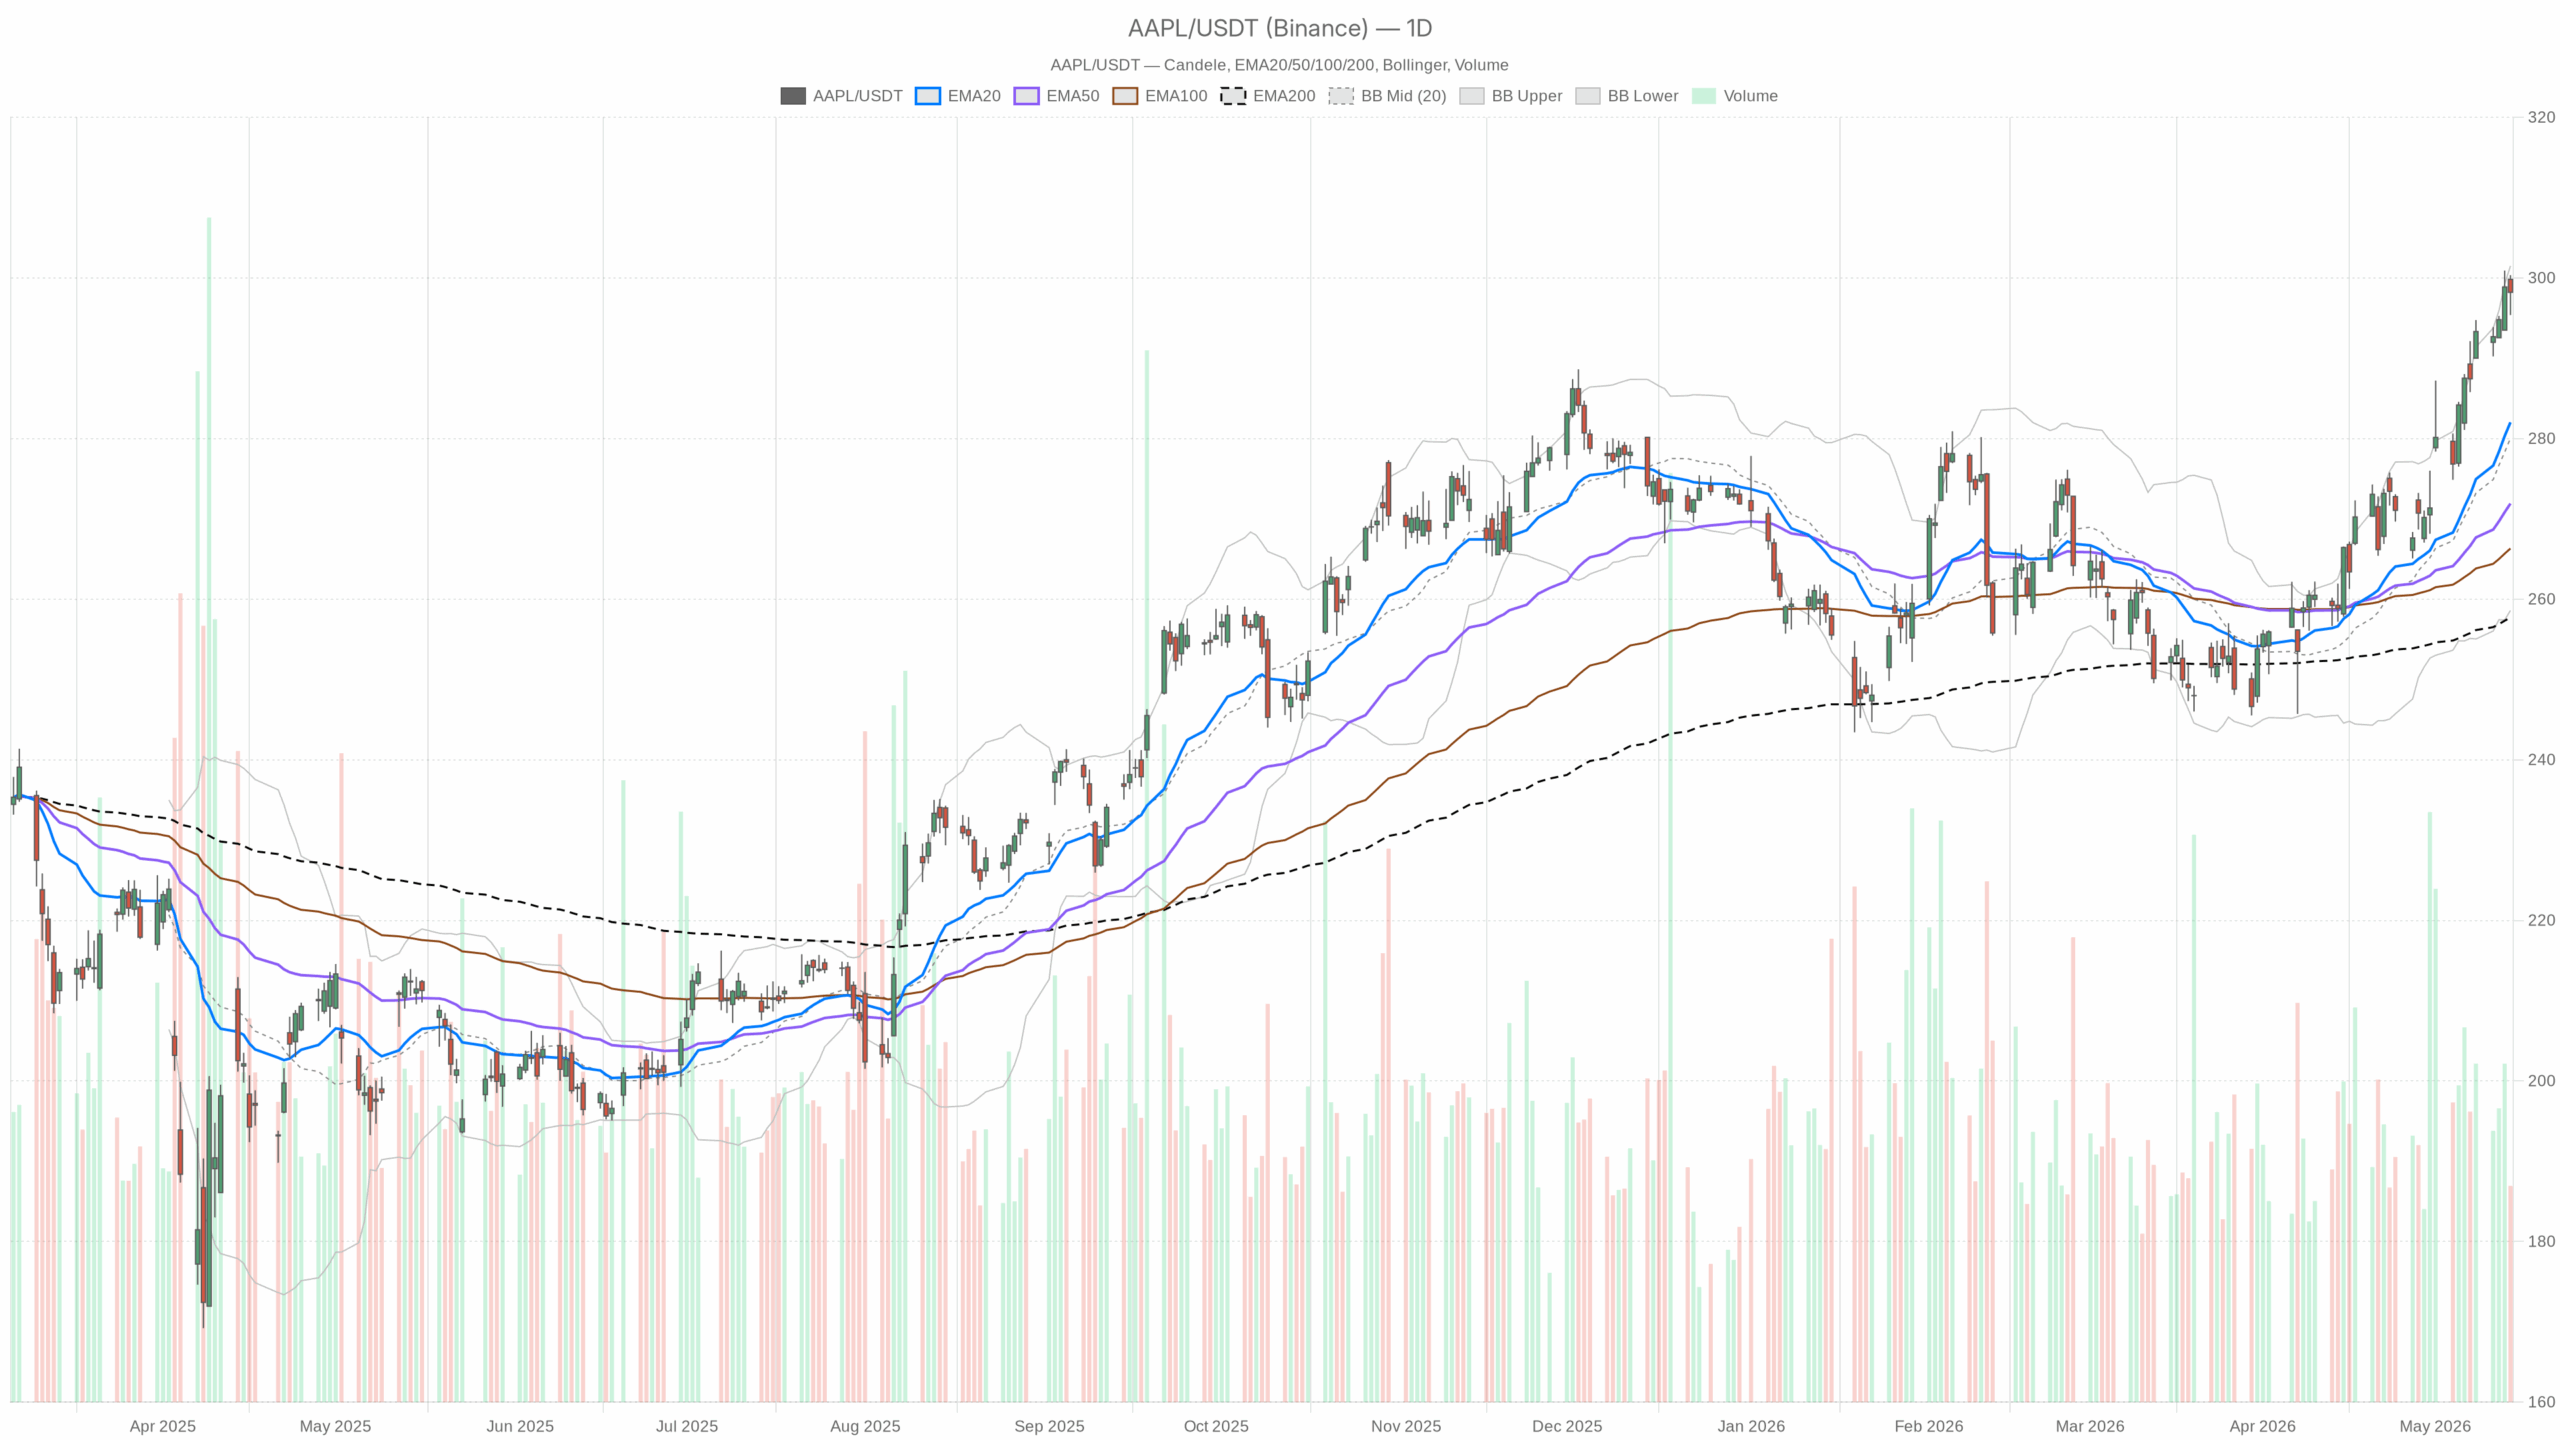 AAPL — daily chart with candlesticks, EMA20/EMA50 and volume.
Apple Stock daily trend: uptrend firm near $300
Trend, momentum, and bands
On the daily chart, AAPL closed at $298.21, above the 20/50/200‑day EMAs (20D 282.02, 50D 271.90, 200D 257.72). Trend control remains with buyers.
RSI‑14 stands at 74.45. That is overbought and raises near‑term consolidation risk. The MACD stays positive (line 9.16 vs signal 7.27, histogram 1.88), keeping momentum aligned with the advance. Meanwhile, Bollinger Bands show a mid at 280.05 and an upper band near 301.50. Price is pressing the upper envelope, which often caps the first push.
Notably, daily ATR‑14 prints 6.61, indicating 1.5%–2% swings are plausible. Pivot levels sit at PP 297.98, R1 300.58, and S1 295.61. Closing essentially on the pivot marks a balanced battleground into the next session.
Hourly momentum cools below $300
On the 1‑hour, price holds above the 20/50/200‑hour EMAs (20H 297.07, 50H 292.54, 200H 277.06). The intraday trend remains positive, yet impulse has faded. RSI‑14 sits at 61.16, keeping momentum constructive but no longer stretched. However, the MACD has slipped (line 1.85 below signal 2.13, histogram −0.27), favoring digestion.
At the same time, hourly Bollinger Bands center on 297.21 with an upper band near 301.38. Price near the mid‑band reflects short‑term equilibrium. ATR‑14 is 1.84, so ranges are active but controlled. Meanwhile, the hourly pivot grid shows PP 298.38, R1 298.88, and S1 297.67; trading just below PP tilts the tape slightly cautious.
15‑minute view: neutral execution context
The 15‑minute view is neutral and offers execution context rather than a thesis. Price sits between short EMAs (20m 298.47, 50m 297.83), leaving the micro‑trend flat to mildly corrective. Still, RSI‑14 prints 47.16, and the MACD is flat (line 0.08 vs signal 0.09, histogram −0.01).
In contrast, Bollinger Bands are tight, centered at 298.49, with an envelope between 297.59 and 299.39, which signals near‑term chop. ATR‑14 is 0.71; micro swings are contained. Meanwhile, the 15‑minute pivot grid has PP 298.25, R1 298.61, and S1 297.80. Price just under PP says sellers are probing but lack follow‑through.
Apple Stock scenarios and key levels
Bullish continuation triggers
Therefore, the main scenario is bullish, anchored by the daily uptrend and positive MACD. For confirmation, a firm reclaim of the 1‑hour pivot at 298.38 and a push through 298.88 would reassert intraday control. Thereafter, a break above daily R1 300.58 would put the upper band near 301.50 in play. RSI holding above 50 on the 1‑hour as MACD re‑crosses up would back the move. Interpretation: regained momentum and cleared resistance would validate continuation.
Mean‑reversion path
On the other hand, repeated failure to clear 299–301 would open a mean‑reversion phase. A drop through daily S1 295.61 would expose the 1‑hour 50‑EMA near 292.54. If pressure persists, the daily 20‑EMA at 282.02 is the next major trend line. Interpretation: momentum cool‑off turns into a broader reset toward the rising mean.
News context: mixed but not thesis‑breaking
Headlines are mixed but not thesis‑breaking for Apple Stock. Reports of strain around an OpenAI partnership knocked the stock intraday, while Evercore’s call for stronger Services‑driven EPS and broader AI‑refresh expectations support the longer‑term narrative. Therefore, the shallow pullback that held trend support aligns with a market that is extended but not reversing.
Bottom line for Apple Stock
Overall, Apple’s trend is up, but it is extended. Expect choppy, two‑way trade around the $298–$301 zone until hourly momentum re‑accelerates or daily RSI eases. Volatility is active but orderly, so position sizing and entry timing matter more than usual while the market decides the next leg.


You May Also Like

Alphabet and Amazon accelerate AI spending as Anthropic and OpenAI fight for business dominance
Arista Networks (ANET) Stock Gets a Boost as Raymond James Upgrades on AI Bet


