

Nokia Stock nears resistance as overbought momentum stays hot

Nokia Stock (NOK) is pressing higher on a powerful daily uptrend, but it is running into nearby resistance. Shares closed at 13.92, with buyers still in control and volatility elevated. The main bias is bullish, yet it is late in the swing.
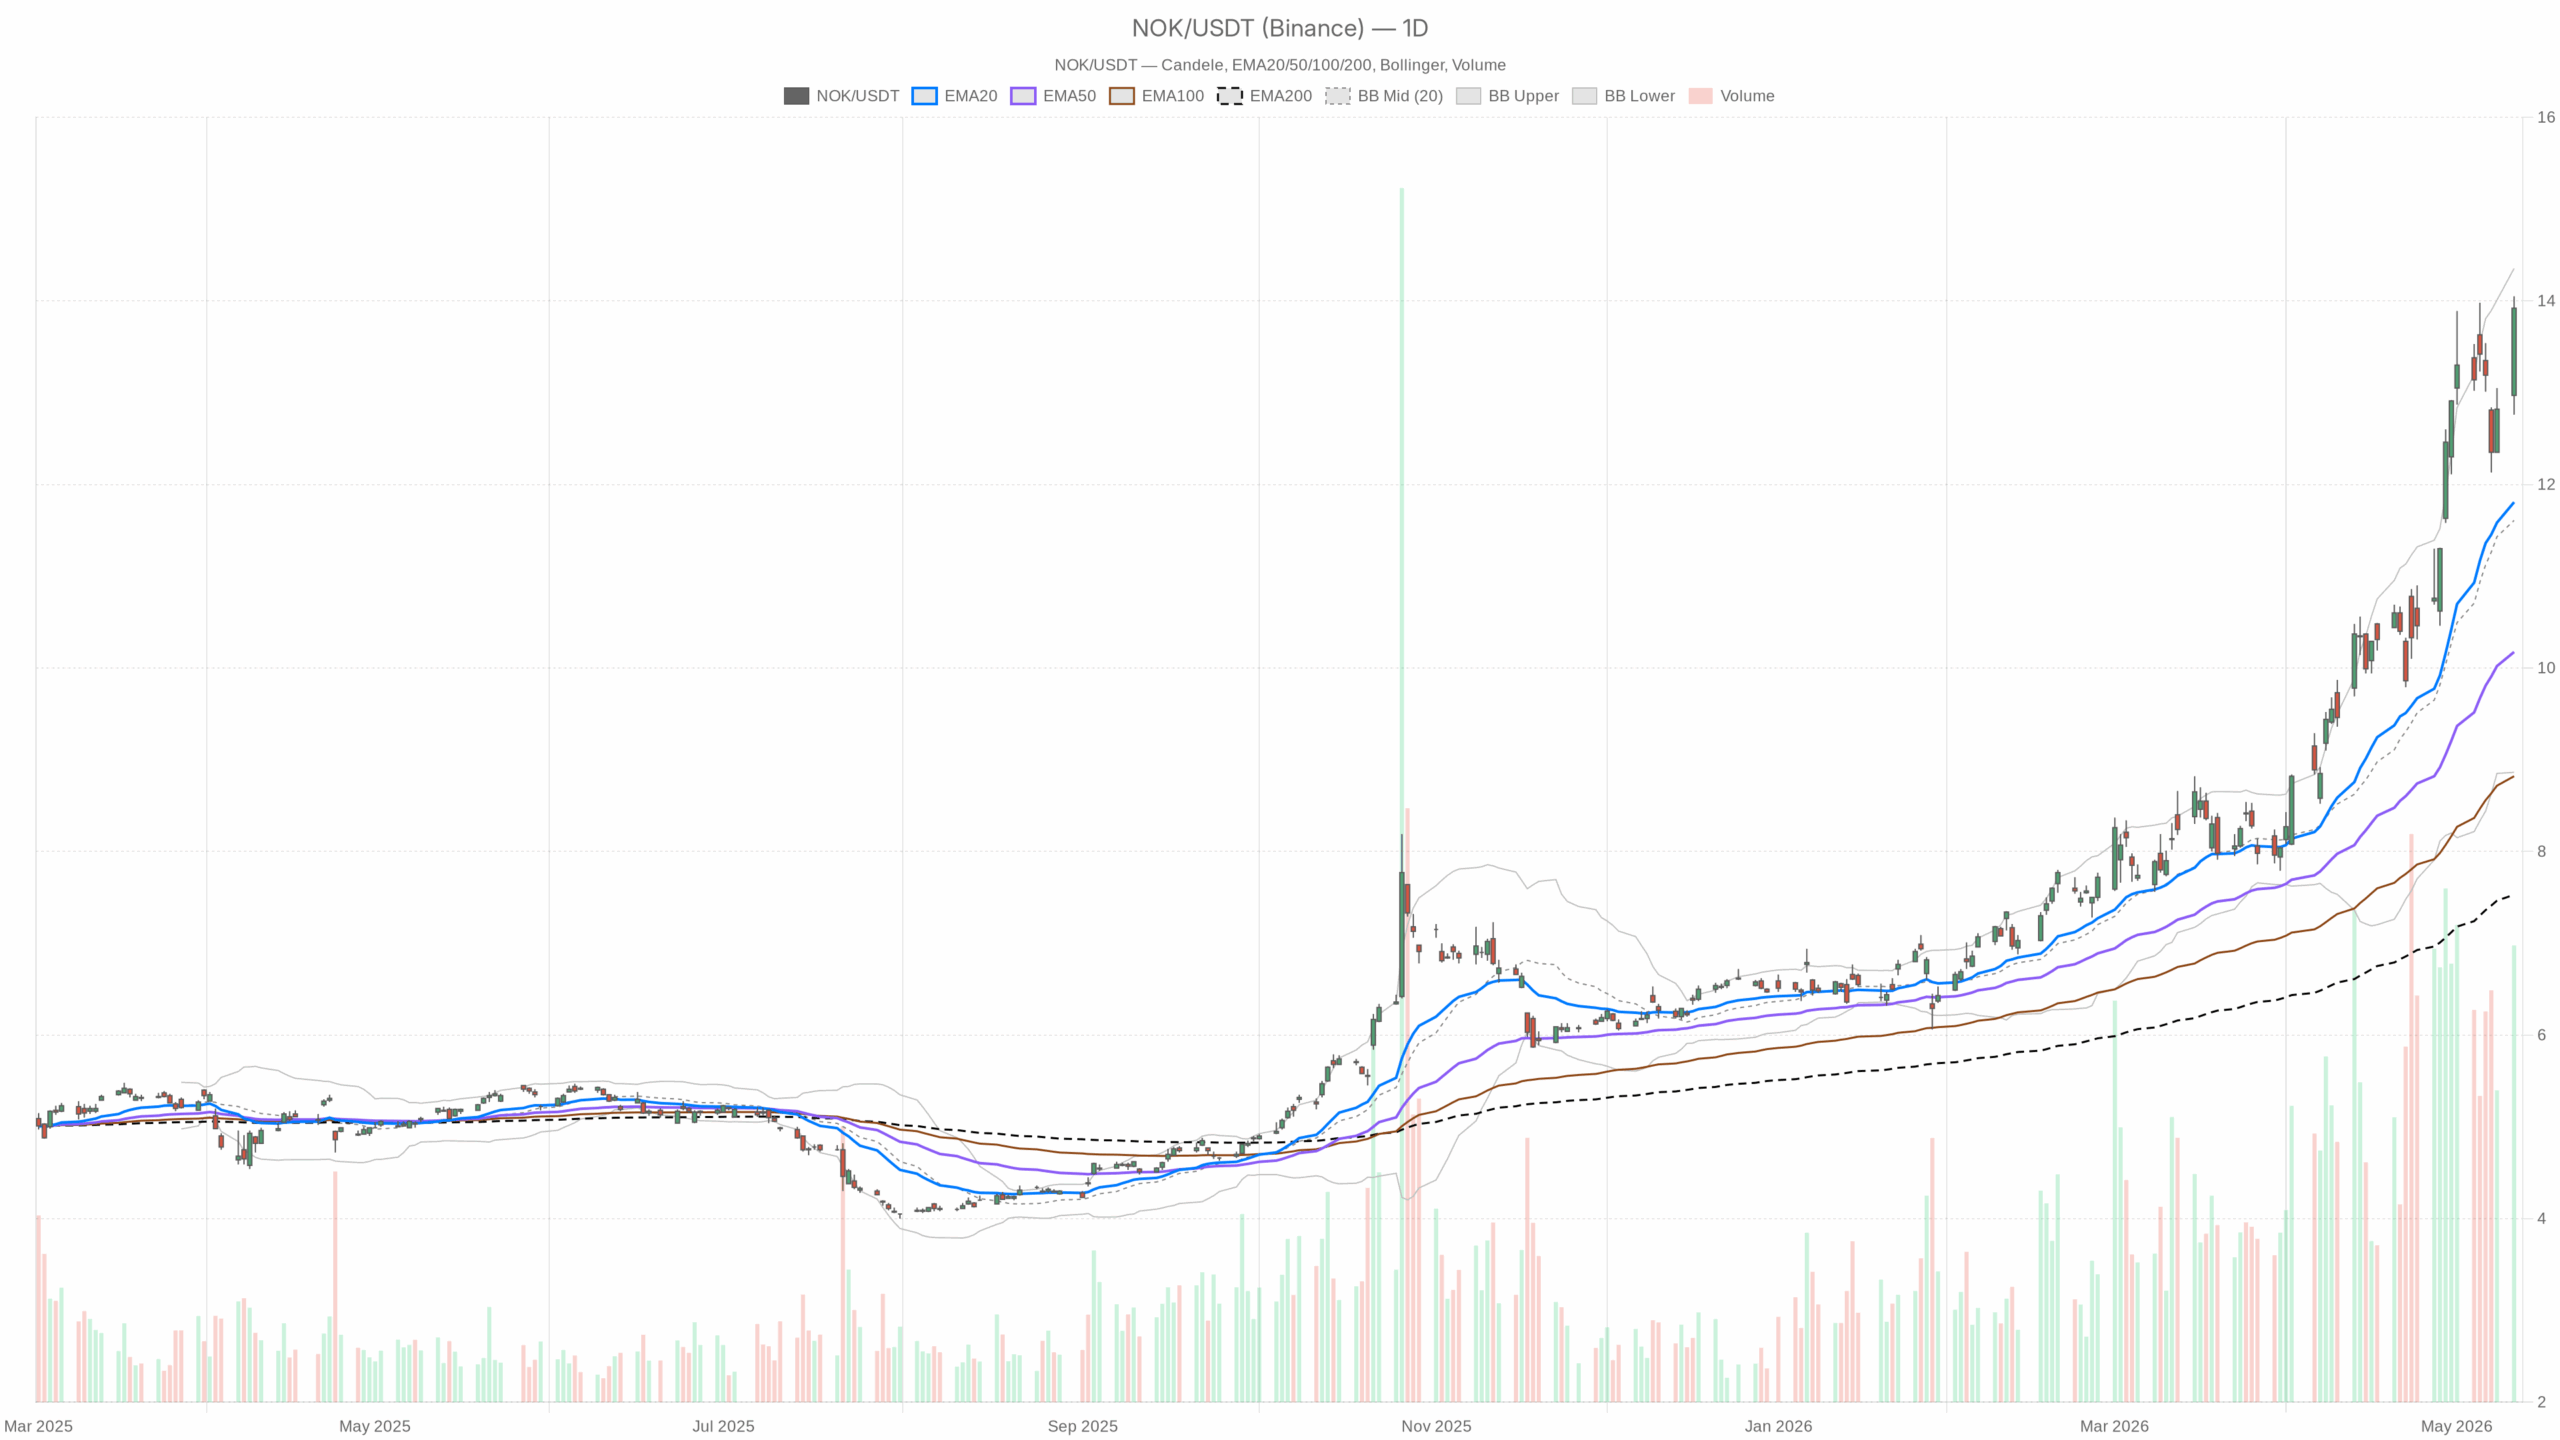 NOK — daily chart with candlesticks, EMA20/EMA50 and volume.
Nokia Stock Technical Outlook: Daily Trend and Momentum
On the daily timeframe, the regime reads bullish. That signals buyers hold trend leadership. The EMA stack sits at 20/50/200 = 11.81/10.17/7.53. Price is well above all three, underscoring a strong, extended trend.
Meanwhile, daily RSI is 73.7. That is overbought and consistent with momentum strength, yet it leaves the tape vulnerable to a pause. MACD prints line/signal/hist at 1.13/1.02/0.11. Momentum is positive, though acceleration looks modest.
Bollinger Bands are 11.61/14.35/8.86, with price near the upper band. Therefore, mean-reversion risk rises. ATR14 is 0.85. Ranges are wide, increasing both opportunity and whipsaw risk. The daily pivot pack is PP/R1/S1 = 13.58/14.39/13.10. Closing above PP favors buyers, while R1 marks the next ceiling.
Intraday Setup for Nokia Stock: 1-Hour Chart
On the 1-hour chart, the bullish bias holds. EMAs at 13.26/12.91/11.21 slope higher, keeping the intraday trend constructive.
RSI14 at 69.9 is strong but stretched. That allows brief cooling without breaking trend. MACD at 0.26/0.12/0.14 remains positive, so intraday momentum is still building.
Bollinger mid/upper/lower at 12.95/14.17/11.73 frame resistance just above 14.00. That flags a nearby supply zone. ATR14 at 0.28 reflects lively swings; position sizing should respect noise.
The 1H pivot is 13.93 with R1/S1 at 14.05/13.80. Price is sitting around PP, making 14.05 the immediate trigger for Nokia Stock.
15-Minute Micro Structure
At the same time, the 15-minute view shows a minor loss of steam inside an uptrend. EMAs at 13.73/13.37/12.86 remain aligned bullish, so the micro trend is intact.
RSI14 is 65.3. Momentum is positive but less intense than earlier. MACD at 0.21/0.24/-0.03 has a small negative histogram, signaling a short-term pause.
Bollinger mid/upper/lower at 13.80/14.12/13.47 put price mid to high in the band. A brief consolidation near 13.90–14.00 would be normal. ATR14 is 0.12; micro swings of roughly 1% can shake weak hands. The 15m pivot is 13.95 with R1/S1 at 14.03/13.85. Dips toward 13.85–13.90 are the first test of demand.
News and Sentiment Drivers for Nokia Stock
Notably, recent developments lean supportive for sentiment and reinforce the software and security narrative around NOK.
- Nokia rolled out agentic AI across its fixed network portfolio to boost operations and cut costs. This supports automation tailwinds.
- Partnership with Cinia on managed DDoS protection for Finland’s critical infrastructure. Such security wins can strengthen backlog quality and visibility.
- Inseego outlined its planned acquisition of Nokia’s fixed wireless access device business. Portfolio reshaping may concentrate resources on core networks and cloud-aligned offerings.
Nokia Stock Scenarios: Bullish Path and Risk Markers
Bullish continuation triggers
Therefore, the bullish path remains the base case while daily momentum holds. A clean push through 14.05 on the 1H chart would likely test 14.35–14.39, combining the daily upper band and R1. That would confirm buyers in control. For execution, a 15m MACD turn back to positive with RSI holding above 60 would help. Holding above the daily PP at 13.58 would keep the structure healthy.
Bearish fade levels and risk
On the other hand, failure to clear 14.05 and a slip below 13.80 on the 1H would weaken the tape. That would open a move toward 13.58 and possibly 13.10, the daily S1. An RSI cool-off from the 70s on daily would reflect that unwind. A negative hourly MACD cross with price closing below the 1H 20-EMA would add confirmation. Only a deeper break would target the daily 20-EMA near 11.81, which is the mean-reversion risk if momentum cracks.
Bottom Line on Nokia Stock
Overall, NOK trades in a strong uptrend with late-swing stretch and nearby resistance. The bias is pro-trend, but the overbought state and elevated ATR argue for caution into resistance. Expect bigger ranges around 14.00 as the market tests supply. Flexibility matters while momentum stays firm, not explosive.


You May Also Like

Trump 'like the dog who caught the car' as Americans blame him for economy: strategist

XRP To $10? Thesis Links CLARITY Act To Bank-Scale Liquidity


