PEPE Price Prediction Following Canary Capital’s Spot ETF Filing
Canary Capital’s spot PEPE ETF filing has put PEPE meme coin back into focus this week, yet the price moved in the opposite direction almost immediately. The filing reached the SEC on April 8, but PEPE dropped below $0.0000035 within 24 hours. That reaction shows something important. Market structure and broader sentiment still carry more weight than headlines, even when the news looks positive on the surface.
PEPE price declined by more than 5% over the past 24 hours, trading below $0.0000035 despite the ETF development. The move had little connection to the filing itself. Broader market weakness and geopolitical uncertainty played a bigger role in the decline.
That reaction reveals something important. PEPE did not reject the ETF narrative. The market simply remains cautious across risk assets, and meme coins often feel that pressure faster than larger assets.
Crypto Patel discussed the ETF filing and pointed to its importance for meme coins. That perspective focuses on the long-term potential of institutional exposure. The short term chart still shows hesitation, and that is where the current PEPE price prediction becomes more interesting.
PEPE Technical Indicators Show A Balanced Market With No Clear Direction
A look at key indicators shows a mixed and neutral setup across the board:
| Name | Value | Action |
|---|---|---|
| RSI(14) | 50.236 | Neutral |
| STOCH(9,6) | 49.791 | Neutral |
| MACD(12,26) | 0 | Neutral |
| ADX(14) | 20.44 | Sell |
| CCI(14) | 82.328 | Buy |
| Highs/Lows(14) | 0 | Neutral |
| Ultimate Oscillator | 47.995 | Sell |
| ROC | 2.053 | Buy |
| Bull/Bear Power(13) | 0 | Neutral |
This data presents a clear picture. RSI near 50 shows no strong bullish or bearish pressure. Stochastic also stays near the middle, which means momentum has not stretched in any direction.
MACD sitting at zero confirms that trend strength remains weak. ADX at 20.44 supports that view, showing the market lacks a strong directional trend.
Another factor deserves attention. CCI and ROC show some bullish signals, which means buyers still appear at certain levels. Ultimate Oscillator leans slightly bearish, so sellers still maintain some control.
Read Also: Hedera (HBAR) Flashes 5x Signal This Month As Key Metrics Align
The overall structure shows a neutral market. That setup often leads to a sharp move once price breaks out of consolidation. The next move could go either way depending on how key levels react.
PEPE Descending Channel Structure Continues To Define The Trend
The chart shows PEPE trading inside a descending channel that started around May 2025. Each attempt to move higher has faced rejection near the upper boundary, which confirms that resistance remains strong.
Recent price action still sits close to the lower part of the channel. That position keeps pressure on buyers and limits upside attempts.
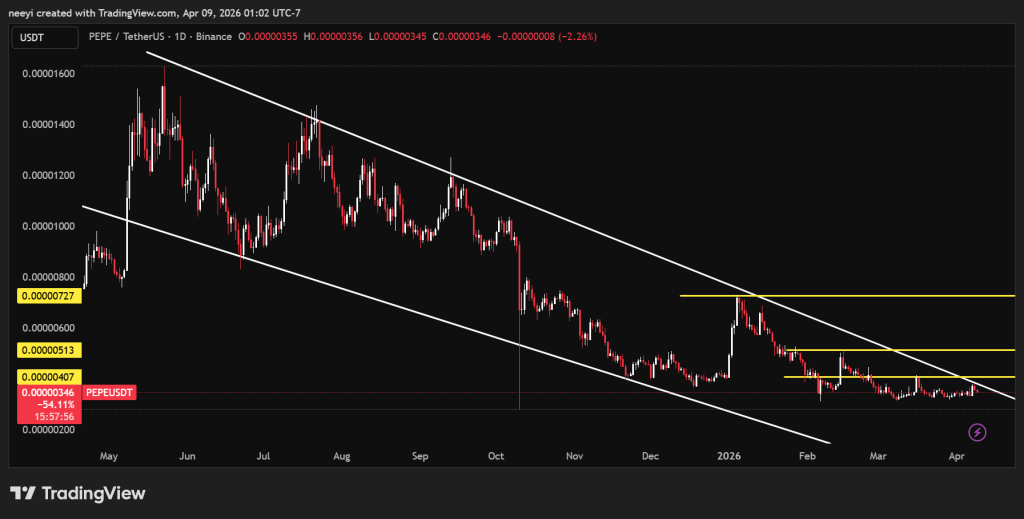 PEPE Price Chart / Source: TradingView.com
A move above the resistance area near $0.0000041 could change the structure. That level aligns with the upper trendline of the channel and previous rejection zones.
If PEPE breaks above that level, the next targets appear around $0.0000051 and then $0.000007. These levels match previous reaction zones and could act as the next areas where price pauses or reacts.
Failure to break above resistance would keep the current structure intact. That outcome would likely lead to continued sideways movement or another test of lower support levels within the channel.
Read Also: Ripple’s Top Lawyer Joins Board of XRP Treasury Company Going Public on Nasdaq
Crypto Patel returned to the ETF discussion and focused on what it could mean over time. A spot ETF holding actual PEPE tokens introduces a new layer of accessibility for traditional investors. That factor could become more relevant if the SEC moves forward with the application.
Short-term price action still depends on technical structure. The current setup shows a market waiting for direction, and the descending channel continues to control that outcome.
A confirmed breakout could open the door for higher levels, while continued rejection would keep PEPE under pressure.
Subscribe to our YouTube channel for daily crypto updates, market insights, and expert analysis.
The post PEPE Price Prediction Following Canary Capital’s Spot ETF Filing appeared first on CaptainAltcoin.


You May Also Like

Zhao Changpeng Reveals Why Bear Markets Create Unbeatable Web3 Opportunities

Why Effective Drainage Solutions in Brisbane Include Regular Stormwater Drain Cleaning