

Will Bitcoin Crash to $61,000 or Surge to $82,800? BTC Price Prediction June 2026
- Bitcoin has fallen sharply from above $70,000 to $66,000 in a matter of days, with the Fear & Greed Index sitting at 25 — one of the steepest short-term declines of the current cycle.
- $73,869 — the 0.236 Fibonacci retracement level — is the single number that controls BTC's near-term direction: a confirmed three-day close above it reopens the path to $76,500 and beyond.
- Both AI-driven technical models and the bear flag visible on the daily chart since February converge on a June 30 downside target near $61,000–$62,678 if $73,000 support fails.
- Bernstein is maintaining a year-end Bitcoin target of $150,000, while JPMorgan's gold-parity model points to $170,000 and Fundstrat's Tom Lee projects $200,000–$250,000 by end-2026.
- ARK Invest's 2030 base case values Bitcoin's market cap at $16 trillion, implying a per-coin price of approximately $761,000 based on a supply approaching 21 million BTC.
- The Federal Reserve's June 17 interest rate decision is the month's most critical catalyst — a dovish signal could trigger a sharp recovery, while a hawkish surprise brings $61,000 significantly closer.
Bitcoin Just Crashed! Here's the Data Every BTC Trader Needs to Know
Bitcoin (BTC) Price Prediction — How Low Can BTC Drop This June?
Bull Case: Bitcoin Has a Clear Path Back to $78,000, Here's Why
Bear Case: BTC Could Fall to $61,000 — and Here's the Evidence
The One Level That Decides Everything for BTC This Month
What Major Institutions Are Forecasting for the Bitcoin Price
Bernstein Holds Firm at $150,000 — Why the Biggest Bulls Aren't Flinching
JPMorgan's Gold Model Points to $170,000 — Tom Lee Is Calling $250,000
ARK Invest's 2030 Bitcoin Price Target: $761,000 — Here's the Math Behind It
Bull or Bear? The BTC Price Scenarios That Could Define Bitcoin's Next 90 Days
What Bitcoin Bulls Are Counting On
What the Bears Are Warning About the Bitcoin Price
Why June 17 Is the Most Important Date for the Bitcoin Price This Month
Frequently Asked Questions
Conclusion
Popular Articles
View More
What Does BTC Mean in Text? We Read All 56 Slang Entries. "Because They Can" Isn't One.
Search "what does BTC mean in text" and the same answer comes back from site after site: "Because They Can." There is no record of anyone ever saying that. Two of them are the ones you'll actually

MEXC On-chain Daily Report:Russia’s State Duma will review a cryptocurrency regulation bill
Updated: July 21, 2026, 9:30 (UTC+8)|Author: MEXC Headlines Russia’s State Duma will review a cryptocurrency regulation bill. Superseed is abandoning its Layer2 and requiring users to migrate assets

MEXC Alpha Trader Research Weekly | ETF Outflows End After 8 Weeks, but a $425M Sell-Off Raises the Question: Who Is Driving BTC?
Week 2 of July 2026 Statistical Period: July 8, 2026 – July 14, 2026 Data Cutoff: July 14, 2026 Core Narrative Over the past week, the crypto market experienced a dramatic reversal, shifting from a

MEXC Alpha Trader Research Weekly | NFP Sparks a Rebound, but ETF Outflow Pressure Lingers: Can BTC Hold $63,000?
Week 1, July 2026 Reporting Period: July 1–7, 2026 Data Cutoff: July 7, 2026 Core Narrative Over the past week, the crypto market experienced a dramatic reversal, falling first before staging a
Hot Crypto Updates
View More
Bitcoin Price Eyes $65,000 as Standard Chartered Backs $100,000 Target: Is the Bottom In?
Key Takeaways Bitcoin (BTC) has rallied from about $61,400 on July 6 to an intraday high of $64,653 on July 10 and trades near $63,800 at the time of writing, as risk appetite returns across crypto.

Why Is Crypto Down Today? Bitcoin Slides Toward $62,000 as US-Iran Ceasefire Collapses
Key Takeaways Bitcoin (BTC) fell more than 2% to around $62,000 on July 8, 2026 after US President Donald Trump declared the ceasefire with Iran over at the NATO summit in Ankara. More than $450

Will Nonfarm Payroll Move Bitcoin Tonight?
Overview The U.S. June nonfarm payrolls report will be released at 8:30 a.m. ET on July 2, 2026. According to the U.S. Bureau of Labor Statistics release schedule, this report is coming on Thursday

Trending News
View More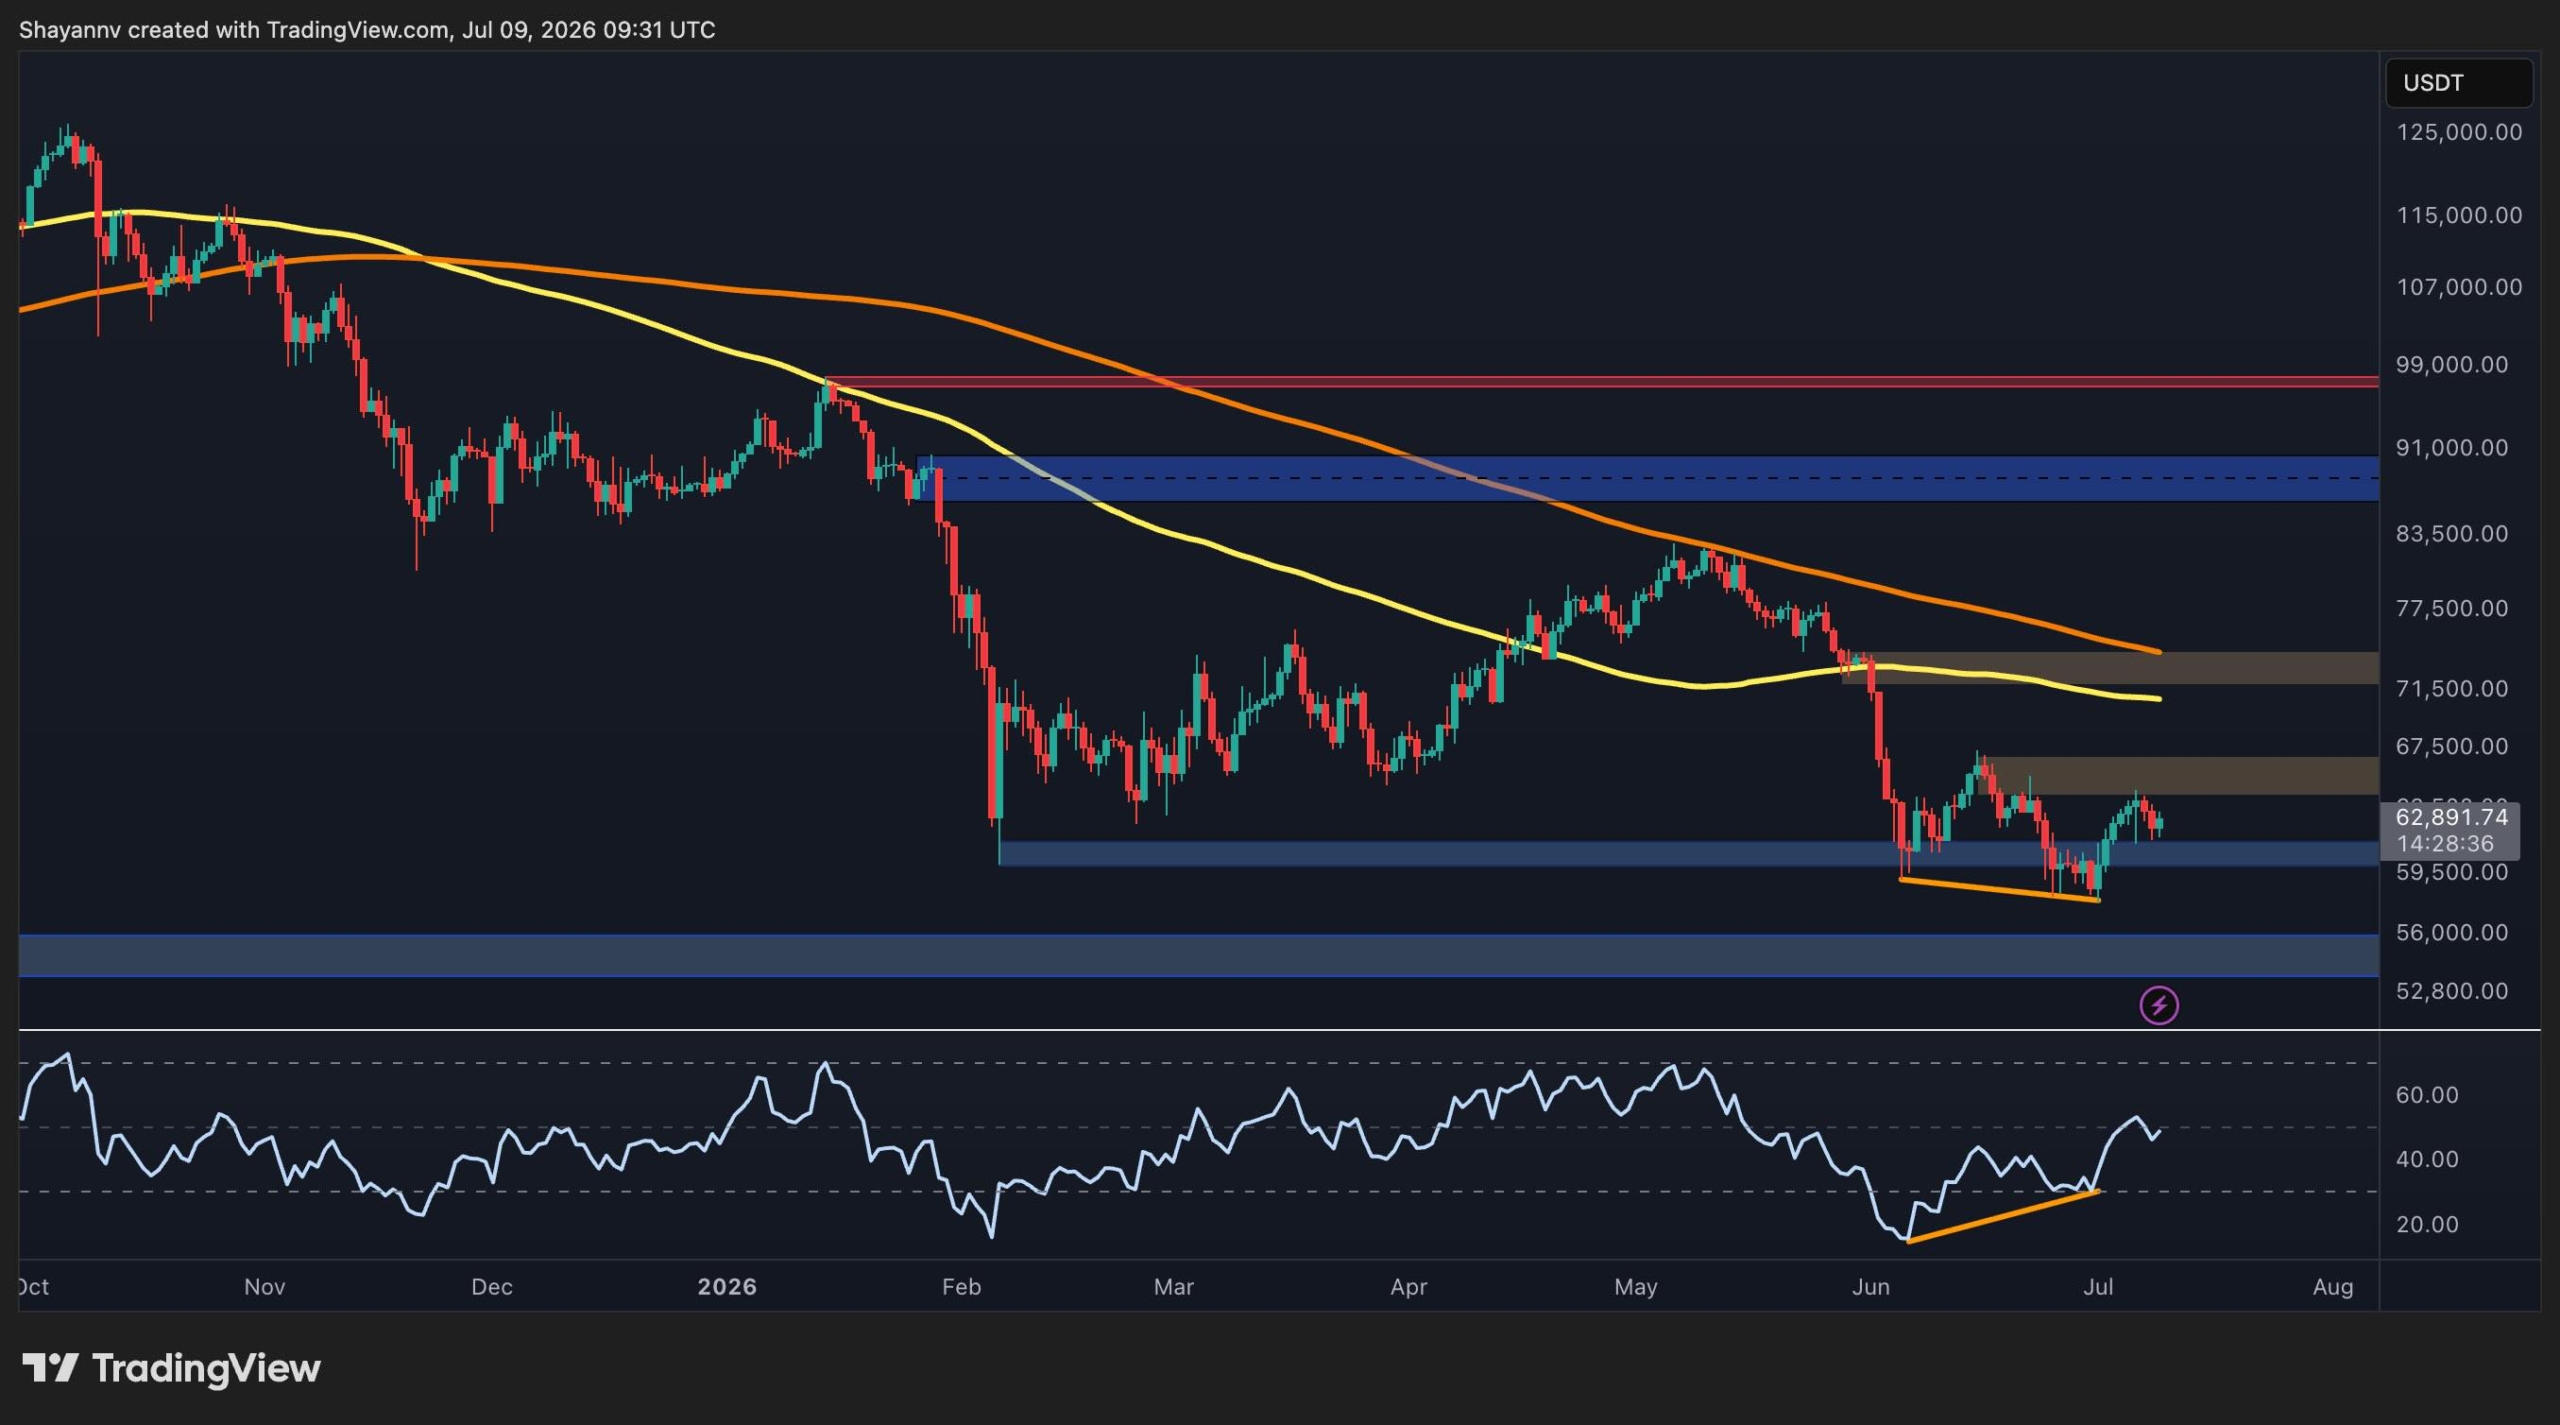
Bitcoin Price Analysis: Has BTC Cleared the Danger Zone After $64K Surge?
Despite showing signs of short-term stabilization above a major support zone, Bitcoin’s downtrend might not be over yet. While momentum has improved on lower timeframes

JPMorgan Says Bitcoin’s Bigger Risk Is Permissioned Blockchains
JPMorgan says Bitcoin's biggest long-term risk isn't Strategy selling BTC—it's the rise of permissioned blockchains that could bypass public chains and crypto


Related Articles
View More
JPM Price Target Hits $418. The Stock Closed at $342.89. Who's Right?
JPMorgan Chase reported the largest quarterly profit in its history on July 14, 2026.The stock opened lower anyway.By the closing bell it had erased the drop and set a record at $342.89, and analysts

U.S. Stock Weekly Report | July 04–10:: SK Hynix Officially Debuts on Wall Street — Behind the Largest ADR in History, AI Memory Investment Logic Sees a Historic Shift
On July 10, 2026, something that had been waiting for a long time on Wall Street finally happened: SK Hynix (SK Hynix) officially listed on NASDAQ with the code SKHY , raising a fundraising scale of u

TRON (TRX) Price Prediction July 2026: Will TRX Finally Break Its Three-Week Trading Range?
TRX has spent the last three weeks doing something that looks boring on a chart but actually matters.It has held a tight range.TRON's token has stayed locked between roughly $0.31 and $0.33 for three


