

How to Read XRP RSI: Overbought, Oversold, and What It Really Means
- Before learning RSI, make sure you understand XRP basics in our complete guide.
- The RSI is a momentum oscillator that moves on a scale from 0 to 100, using a default 14-period lookback to measure how fast and how strongly price is moving.
- An XRP RSI above 70 signals overbought conditions, while a reading below 30 indicates oversold territory — but neither is a guaranteed trade signal on its own.
- RSI behaves differently across market cycles: in a bull market, readings tend to stay elevated; in a bear market, the same number can already signal strong resistance.
- RSI divergence — when price and the RSI move in opposite directions — often appears before the price reacts and is one of the most powerful signals beginners overlook.
- Pairing XRP RSI with indicators like MACD and moving averages produces stronger, more reliable signals than using RSI alone.
What Is the RSI Indicator in Crypto?
How to Read XRP RSI: Overbought and Oversold Signals Explained
XRP RSI Above 70: Overbought Territory
XRP RSI Below 30: Oversold Territory
How XRP RSI Behaves Differently in Bull and Bear Markets
XRP RSI Divergence: Bullish and Bearish Signals Explained
How to Use XRP RSI With MACD and Moving Averages
FAQ
Conclusion
- For a broader understanding of XRP's market and technology, read our comprehensive XRP guide.
Popular Articles
View More
XRP vs Bitcoin Comparison: Speed, Utility, and What Each One Actually Does
Most people searching "XRP Bitcoin" aren't confused about which is which. They're asking a sharper question: if I had to choose between the two, what am I actually choosing between? This article

Will the CLARITY Act Send XRP Past $2? XRP Price Prediction June 2026
XRP is testing one of the most important price levels it has seen all year. The token dropped to around $1.20 on June 3, breaking through the $1.25 support that had been holding since February 2026.
Why Is XRP Dropping? 4 Key Reasons Behind the Price Down
XRP has puzzled investors as its price continues falling despite major positive developments. While Ripple secured regulatory wins and launched spot ETFs, XRP trades near $1.46, down roughly 60% from

Hot Crypto Updates
View More
XRP Q2 2026 Price Prediction: Has the Bottom Arrived or Is the Sell-Off Not Over?
XRP is trading near $1.24 in Q2 2026 as spot ETF inflows hit a yearly high and the CLARITY Act clears a Senate committee. Here's what analysts really expect — and why the divergence matters. Overview

XRPL 3.2.0 Is Live: The End of rippled, and What XRP Holders Actually Need to Do
XRP Ledger's v3.2.0 mainnet upgrade activated on June 15, 2026, renaming the core server software from rippled to xrpld and cutting node memory usage by up to 40%. Here's what it means for XRP

The CLARITY Act Is Closer Than Ever — What It Means for XRP, SOL, and the Next Bull Cycle
The CLARITY Act entered the Senate calendar on June 1, 2026, after a bipartisan 15-9 committee vote. With Lummis pushing for a July 4 floor vote, here's what XRP, SOL, and global crypto traders need

Trending News
View More
Dark Defender to XRP Investors: People Will Beg to See These Levels Again
Crypto analyst Dark Defender has once again reinforced his optimistic outlook on XRP, telling followers that the current market conditions may soon become a thing
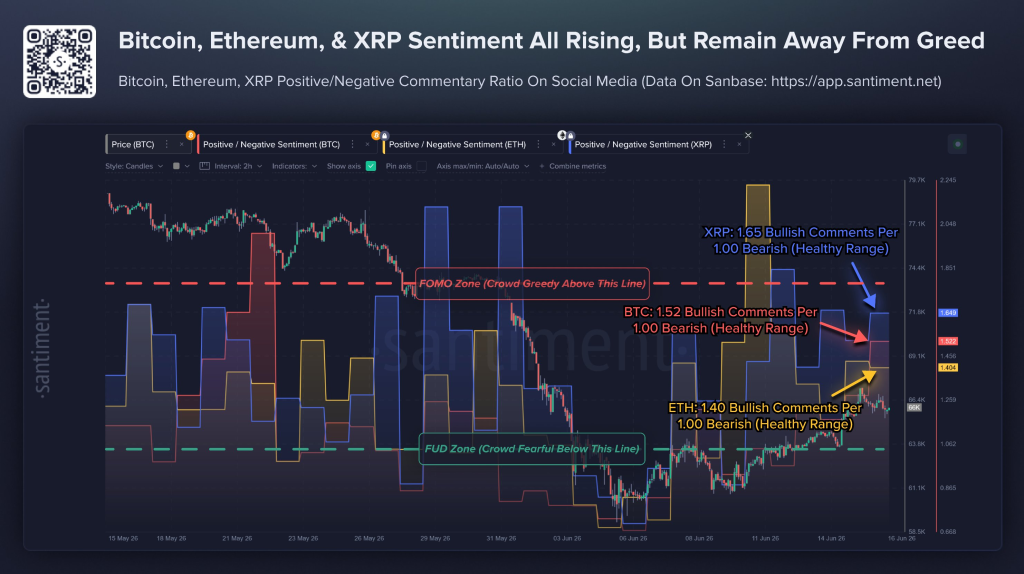
Bitcoin and XRP Crowd Confidence Returns – Here’s Why No Greed Yet Is a Bullish Sign
Crypto’s three largest communities, Bitcoin, XRP, and Ethereum, are showing signs of optimism again. The U.S.-Iran agreement removed a major geopolitical headwind

Related Articles
View More
ETH/BTC Ratio: What It Means, How It Moves, and Why It Matters
The ETH/BTC ratio is one of the most closely watched numbers in crypto — and for good reason.It tells you, at a glance, whether Ethereum is gaining ground on Bitcoin or falling behind, without ever lo

Michael Saylor Bitcoin Holdings, Strategy, and Price Prediction Guide
Michael Saylor is one of the most influential — and polarizing — names in Bitcoin today.As the executive chairman of Strategy (formerly MicroStrategy), he has become one of the most prominent figures

Bitcoin Transaction: How It Works, How Long It Takes, and How to Track It
Most people send Bitcoin without knowing what actually happens the moment they hit "send."This guide breaks down everything a beginner needs to know — how a Bitcoin transaction moves through the netwo


