How to Read a BTC Candlestick Chart? Patterns, Wicks, and Timeframes
- A Bitcoin candlestick chart displays four data points per candle — open, high, low, and close — giving traders far more information than a simple line chart.
- Green candles mean BTC closed higher than it opened; red candles mean it closed lower.
- The body shows the open-to-close range, while the upper and lower wicks mark the session's price extremes.
- Timeframe selection matters: short intervals suit active traders, while the daily and weekly charts serve longer-term analysis.
- Four patterns — Hammer, Shooting Star, Doji, and Engulfing — form the core of Bitcoin candlestick chart analysis.
- Candlestick patterns work best when combined with RSI and moving averages, not used in isolation.
What Is a Bitcoin Candlestick Chart? BTC Price Chart Basics Explained
Bitcoin Candlestick Chart Anatomy: Body, Wicks, and OHLC Explained
The Candle Body
The Upper Wick
The Lower Wick
How to Read BTC Candlestick Chart Timeframes
Key Bitcoin Candlestick Chart Patterns: Reversals and Signals to Watch
Hammer — Bullish Reversal Signal
Shooting Star — Bearish Reversal Signal
Doji — Market Indecision
Engulfing Candle — Momentum Shift
How to Use Bitcoin Candlestick Chart Analysis in Practice
FAQ
Conclusion
Popular Articles
View More
Larry Fink and Bitcoin: From "Money Laundering Index" to $700K BTC Forecast
Few opinion reversals in finance carry as much weight as Larry Fink's journey with Bitcoin. The BlackRock CEO went from calling BTC a criminal's tool to running the world's largest Bitcoin fund — and

Bitcoin Malaysia: BTC Price in Ringgit, Legal Status, and How to Get Started
Malaysia is one of Southeast Asia's most crypto-curious markets, and Bitcoin sits at the centre of that conversation. Whether you're searching for the latest Bitcoin price in Malaysia, wondering if

Bitcoin Order Book Explained: BTC Depth, Spread, and Heatmap Analysis
Most Bitcoin traders spend all their time on price charts — but the BTC order book tells a different story. It shows you where real money is sitting, waiting to buy or sell, before a price move ever

Hot Crypto Updates
View More
Bitcoin Crashes Below $66K: $1.86B Liquidated — Perfect Storm or Buying Signal?
Bitcoin crashed to $65,000–$66,000 in 24 hours, triggering over $1.86B in liquidations. Strategy's first BTC sale in 4 years, record ETF outflows, US-Iran tensions, and an AI stock rotation all

Congress Moves to Lock Bitcoin Into U.S. Law: What the ARMA Bill Actually Does
The U.S. Congress introduced the ARMA bill on May 21, 2026, proposing to codify a Strategic Bitcoin Reserve into federal law, authorizing the Treasury to acquire up to 1 million BTC over five years.

Why Is Bitcoin Rising Today?
Why is Bitcoin rising today? We break down the three forces behind BTC's May 2026 rally — record ETF inflows, post-halving supply squeeze, and geopolitical safe-haven demand — with price levels, risk

Trending News
View More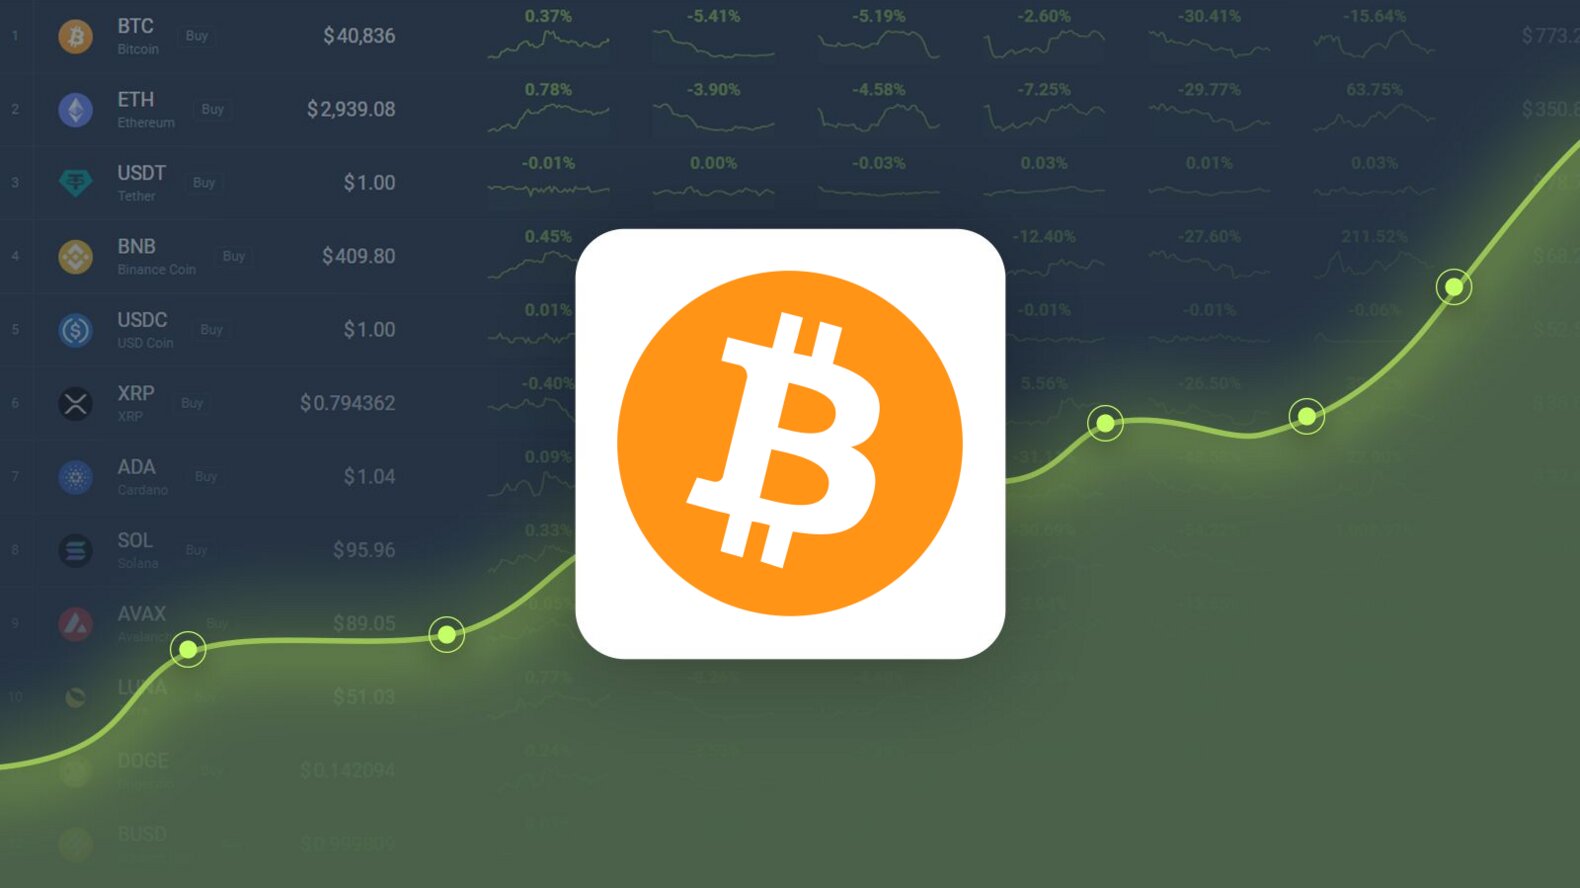
Bitcoin is Predicted to Reach $ 81,961 By Jun 12, 2026
Bitcoin is predicted to increase 31.72% in the next 5 days and hit a price target of $81,961 per BTC. Check out today's Bitcoin price prediction to learn why.
How to Read the BTC/USDT Spot CVD Chart: Volume Heatmap and Order Flow by Trade Size
BitcoinWorld How to Read the BTC/USDT Spot CVD Chart: Volume Heatmap and Order Flow by Trade Size For traders monitoring Bitcoin price action on spot exchanges

Related Articles
View MoreLarry Fink and Bitcoin: From "Money Laundering Index" to $700K BTC Forecast
Few opinion reversals in finance carry as much weight as Larry Fink's journey with Bitcoin.The BlackRock CEO went from calling BTC a criminal's tool to running the world's largest Bitcoin fund — and t
Bitcoin Malaysia: BTC Price in Ringgit, Legal Status, and How to Get Started
Malaysia is one of Southeast Asia's most crypto-curious markets, and Bitcoin sits at the centre of that conversation.Whether you're searching for the latest Bitcoin price in Malaysia, wondering if it'

Bitcoin MVRV Ratio and Z-Score: Definition, Formula, and How to Read It
If you want to understand whether Bitcoin is genuinely overvalued or just expensive, price alone won't give you the full picture.The Bitcoin MVRV Z-Score is an on-chain metric that compares what the m