How Does Crude Oil Inventory Data Move Prices?
Key Takeaways:
The Algorithmic Fake-Out: The initial 1-minute price spike after an inventory report is usually driven by bots trading the headline. The real "smart money" trend begins 5 to 10 minutes later.
Paper vs. Physical Reality: Inventory data forces "paper" derivatives traders to face the reality of physical supply, often triggering massive short squeezes regardless of the actual data.
The Crack Spread Filter: Crude oil data is useless without gasoline data. If crude drops but gasoline builds, refineries will stop buying, turning a "bullish" headline into a bear trap.
Every Wednesday at 10:30 AM EST, the US Energy Information Administration (EIA) releases its crude inventory data. Within seconds, the oil market experiences extreme volatility.
Most retail traders believe this is a simple math equation: if inventory goes down, price goes up. However, modern markets do not work this way. The oil market is a highly manipulated arena dominated by algorithmic trading and institutional hedging.
To trade profitably in 2026, you must stop reading the data like a textbook and start reading the psychology of the market. Here is the real mechanism behind how inventory data moves prices.
The 10:30 AM Algorithmic War
When the clock strikes 10:30 AM, human traders do not have time to read the EIA report. Instead, Wall Street trading algorithms scrape the headline number and execute market orders in milliseconds.
This creates what professionals call the "Algorithmic Fake-Out."
If the headline shows a massive drop in Crude Oil Reserves, bots instantly buy WTI futures. The price prints a massive green candlestick. Amateur traders see this green candle, suffer from FOMO (Fear Of Missing Out), and buy the absolute top.
Five minutes later, human portfolio managers finish reading the full report. If they see that the underlying details are actually weak, they dump their positions. The price crashes, liquidating the retail traders who bought the algorithmic pump. The rule is simple: never trade the first 60 seconds of the EIA data release.
Paper Short Squeezes vs. Physical Data
You must understand that the volume of oil traded on exchanges is massively larger than the physical oil that actually exists. You are trading "paper oil."
Sometimes, a bearish inventory report is released (inventories are high), yet the price of oil explodes upward. Why does this happen? It is all about positioning.
If the market spent three days aggressively shorting oil in anticipation of a bad report, the market becomes "overshort." When the bad data finally drops, the sellers have no more capital to push the price lower. Institutional buyers realize this and start buying heavily, forcing the short-sellers to buy back their positions to cover their losses. This creates a massive short squeeze.
In these moments, your crude oil price forecast should rely on market positioning, not just the raw data.
The Refinery Margin (Crack Spread) Truth
Crude oil has zero economic value until a refinery turns it into usable products like gasoline or jet fuel.
Smart traders do not just look at crude inventory; they look at the "Crack Spread" (the profit margin of a refinery). If the EIA reports a bullish drop in crude oil, but a massive build in gasoline, it means the consumer is not buying fuel.
Gasoline storage tanks will fill up. When this happens, refineries stop making money. They immediately cancel their orders for physical crude oil. The market prices this in instantly, causing crude prices to crash despite the "bullish" headline.
Capitalizing on the Volatility
The Wednesday EIA release creates the best weekly opportunity for macro traders. Because the market often misprices the initial data, you can step in and take the opposite side of the algorithmic fake-out.
To do this successfully, you need the right vehicle. Traditional platforms will lock you out or charge massive slippage fees during these volatile minutes. By understanding what are crypto crude oil futures, you unlock a massive structural advantage.
On MEXC, you can trade the WTI/USDT perpetual contract with zero trading fees. When the data drops and the algorithms push the price to an irrational extreme, you can execute your trade instantly with zero commission drag. Prepare your strategy, manage your risk, and trade the reality of the market, not just the headlines.
Popular Articles
View More
What Is HBM? Why High-Bandwidth Memory Matters for AI Stocks
HBM, short for high-bandwidth memory, is memory built as a vertical stack of chips placed directly beside a processor so data can move at extreme speed. It has become the memory of choice for AI

AI Capex Explained: How Data Centers, GPUs, Foundries and Memory Suppliers Fit Together
AI capex is the wave of capital spending that cloud companies pour into AI infrastructure: data centers, GPUs, networking, power, memory, and the factories that make the chips. It flows in a

Best BitMEX Alternatives 2026: 5 Exchanges to Move to Before September 23
BitMEX will shut down on 23 September 2026 at 04:00 UTC, and every remaining user needs a new derivatives venue within two months. Based on fee, leverage, and listing data verified in July 2026, MEXC

Hot Crypto Updates
View More
What Is BitMine Stock and Why Is BMNR Rising Again in 2026?
Overview BMNR ran from roughly 13 dollars to above 17 in the second week of July, making it one of the few crypto-linked US equities to post a meaningful bounce this month. The trigger was not a

How to Move Your Assets After BitMEX Shuts Down
Overview BitMEX users now face a task that extends beyond closing positions. They need to export account records, withdraw available balances, select the correct blockchain network, confirm deposits

Bitcoin Rebounds Above 66000 Dollars as Markets Reassess Risk and ETF Demand
Overview Bitcoin has rebounded above 66000 dollars, bringing renewed attention to the recovery in crypto markets. As of July 21, 2026, Bitcoin had climbed to approximately 66320 dollars, up about

Trending News
View More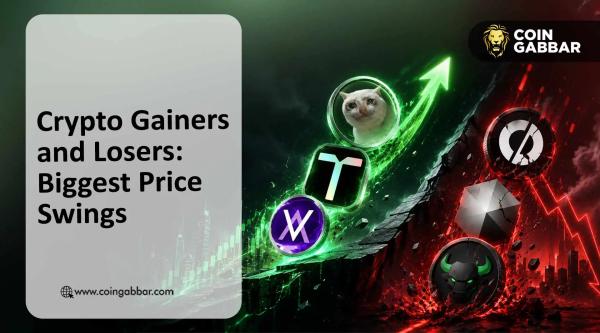
Top Crypto Gainers and Losers Today With Reasons Behind Every Move
Why Are These Top Crypto Gainers and Losers Moving Today? The top crypto gainers and losers today show AI tokens and Solana names pulling in opposite directions

Harry Styles fans flew to Amsterdam, paid a 21% premium for hotels, and sent inflation soaring. One Gen Zer paid $1,000 for a tiny ‘box’ hotel room
Gen Z may be struggling with financial milestones, but after a 10-day concert residence in Amsterdam, Harry Styles fans proved their spending power can move markets

Related Articles
View More
Scott Bessent on U.S. Gold Reserves: Why America’s $1 Trillion Gold Question Matters
Scott Bessent’s comments on U.S. gold reserves touched a market question that never really goes away: how much does America’s gold still matter in a dollar system that is no longer backed by gold?Acco

Brent Crude Oil Price Live: Track Real-Time OIL(BRENT) on MEXC
Looking for the live Brent crude oil price? You can track real-time OIL(BRENT) market data directly on MEXC.Brent crude oil is one of the world’s most important international oil benchmarks. It is wid

WTI Crude Oil Price Live: Track Real-Time OIL(WTI) on MEXC
Looking for the live WTI crude oil price? You can track real-time OIL(WTI) market data directly on MEXC.WTI, or West Texas Intermediate, is one of the world’s most widely followed crude oil benchmarks