BTC Dominance vs Altcoins: Understanding Market Dynamics and Trading Opportunities
New to Bitcoin? Our complete guide covers fundamentals and market dynamics.
- Bitcoin dominance measures BTC's market share percentage against the total cryptocurrency market capitalization.
- Rising dominance typically signals flight-to-safety behavior, while falling dominance indicates growing altcoin confidence.
- Four market scenarios exist based on BTC price and dominance direction, each requiring different portfolio strategies.
- Dominance above 60% historically favors conservative Bitcoin allocation, while levels below 50% often precede altcoin opportunities.
- CoinMarketCap created Bitcoin dominance as the crypto sector's first analytical metric, tracking market sentiment shifts.
- Combine dominance analysis with Ethereum performance and stablecoin metrics for comprehensive market assessment.
What Is Bitcoin Dominance and Why Does It Matter for Altcoins?
BTC Dominance vs Altcoins: How They Move Together (and Apart)
1. Bitcoin Bull Run: When BTC Dominance Rises
2. Altcoin Season: When Bitcoin Rises but Dominance Falls
3. Bear Market: Bitcoin Falls While BTC Dominance Climbs
4. Market Panic: When Bitcoin and Altcoins Both Fall
Reading the Bitcoin Dominance Chart: BTC vs Altcoins Analysis
Trading Strategies: Timing Your BTC and Altcoin Positions
1. Conservative Strategy During Rising Dominance
2. Aggressive Strategy During Falling Dominance
3. Balanced Long-Term Approach
4. Indicators Beyond Dominance
Common Mistakes to Avoid
- Using Bitcoin dominance as your sole trading indicator without considering technical analysis, fundamentals, and market sentiment.
- FOMO buying altcoins during peak dominance decline when markets often approach euphoric tops rather than sustainable rallies.
- Ignoring whether markets operate in bull or bear phases, as dominance behaves differently under varying market conditions.
- Expecting perfectly predictable dominance patterns when cryptocurrency markets remain influenced by countless unpredictable variables.
- Neglecting risk management by allocating entire portfolios based on dominance signals without proper diversification and position sizing.
FAQ: BTC Dominance vs Altcoins
Conclusion
For comprehensive Bitcoin analysis, explore our ultimate beginner's guide.
Popular Articles
View More
MEXC On-chain Daily Report: U.S. Imposes 10%–12.5% Tariffs on 60 Economies
Updated: July 24, 2026, 9:30 (UTC+8)|Author: MEXC Headlines The U.S. imposes 10%–12.5% tariffs on 60 economies. Coinbase adds tokenized RWA assets to its balance sheet. ETH staking rises to 33% of

MEXC Alpha Trader Research Weekly | ETFs See Net Inflows for Two Consecutive Weeks as BTC Reclaims $65K: Bottoming Signal or False Breakout?
Week 3, July 2026 Reporting Period: July 15 – July 21, 2026 Data Cutoff: July 21, 2026 Market Overview The crypto market demonstrated resilience this week amidst complex multi-directional pressures.

Tesla Holds 11,509 BTC in Q2 Despite $112 Million Bitcoin Loss
Tesla’s Bitcoin update looks negative at first glance. A $112 million digital-asset loss is not the kind of number investors usually ignore. But the more important detail is quieter: Tesla did not

Hot Crypto Updates
View More
Bitcoin Price Eyes $65,000 as Standard Chartered Backs $100,000 Target: Is the Bottom In?
Key Takeaways Bitcoin (BTC) has rallied from about $61,400 on July 6 to an intraday high of $64,653 on July 10 and trades near $63,800 at the time of writing, as risk appetite returns across crypto.

Why Is Crypto Down Today? Bitcoin Slides Toward $62,000 as US-Iran Ceasefire Collapses
Key Takeaways Bitcoin (BTC) fell more than 2% to around $62,000 on July 8, 2026 after US President Donald Trump declared the ceasefire with Iran over at the NATO summit in Ankara. More than $450

Will Nonfarm Payroll Move Bitcoin Tonight?
Overview The U.S. June nonfarm payrolls report will be released at 8:30 a.m. ET on July 2, 2026. According to the U.S. Bureau of Labor Statistics release schedule, this report is coming on Thursday

Trending News
View More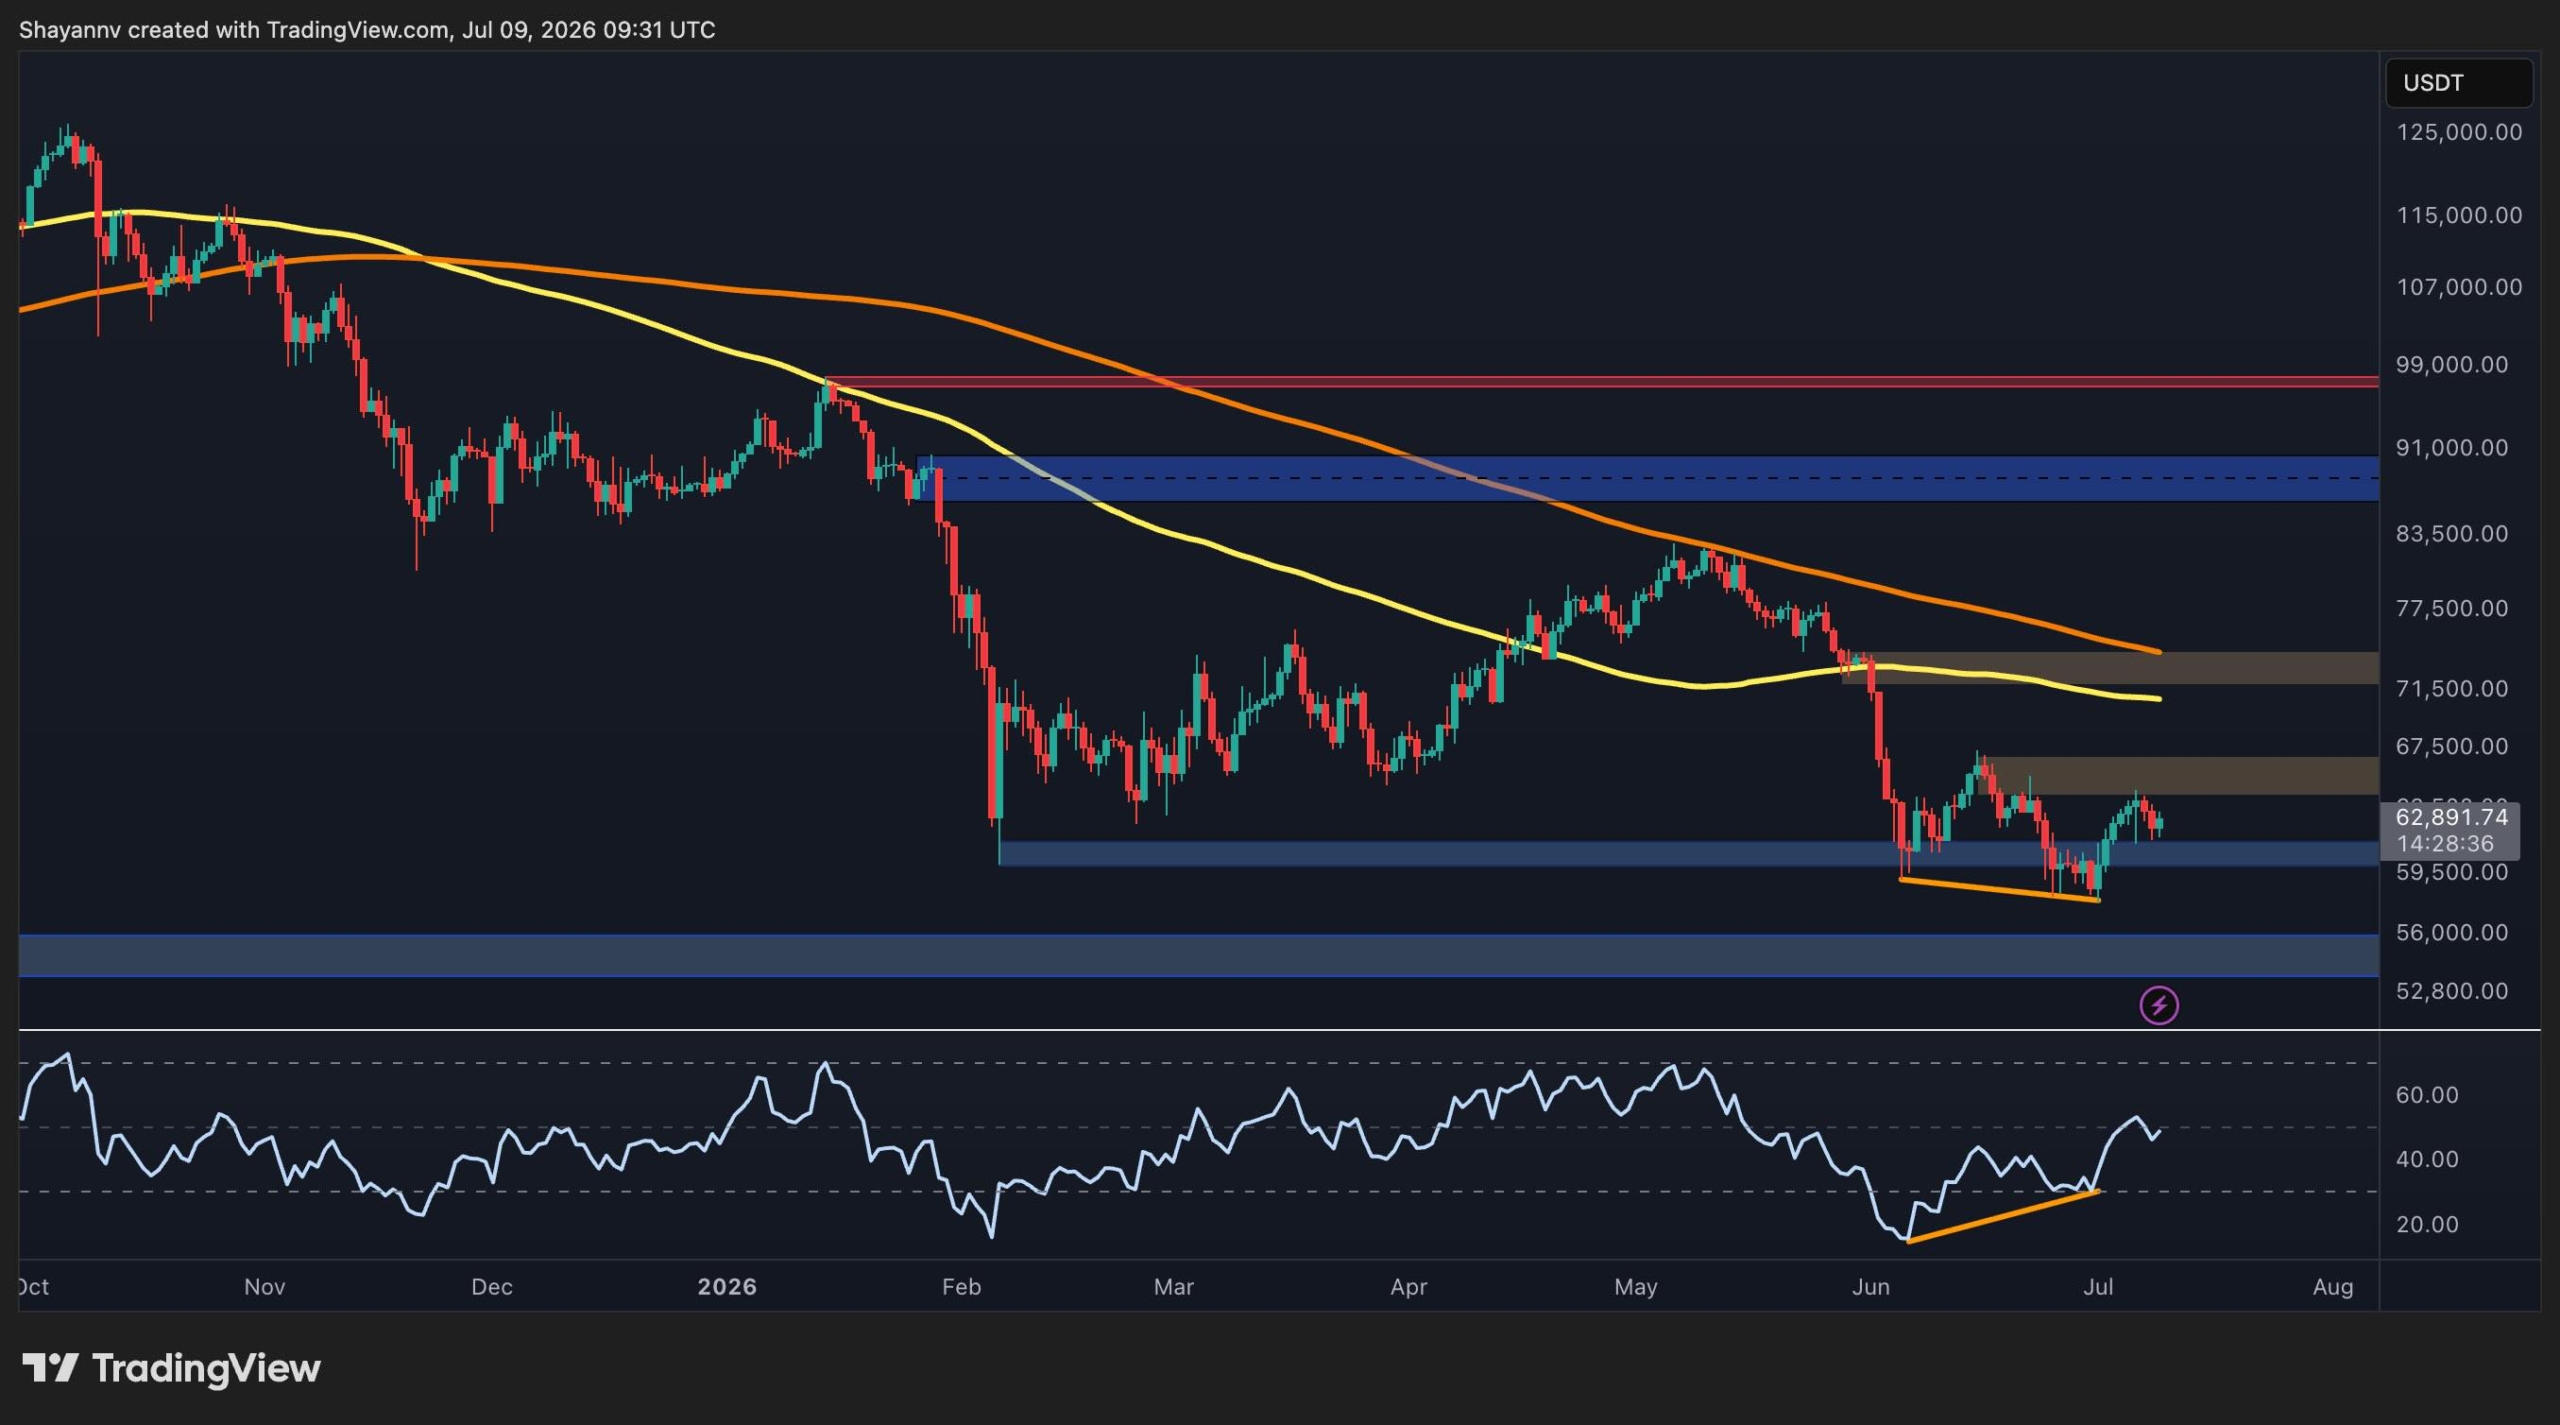
Bitcoin Price Analysis: Has BTC Cleared the Danger Zone After $64K Surge?
Despite showing signs of short-term stabilization above a major support zone, Bitcoin’s downtrend might not be over yet. While momentum has improved on lower timeframes

JPMorgan Says Bitcoin’s Bigger Risk Is Permissioned Blockchains
JPMorgan says Bitcoin's biggest long-term risk isn't Strategy selling BTC—it's the rise of permissioned blockchains that could bypass public chains and crypto
Related Articles
View More
Does XRP Burn Coins? Yes, but Not for the Reason You Think
If you've been holding XRP or thinking about buying it, you've probably seen people arguing about "XRP burns" and wondered what all the fuss is about. The short answer: yes, XRP burns coins — a tiny a

Is XRP Going to Go Up? The Honest Answer No One Gives You
Sooner or later, almost every XRP holder types the same question into a search bar: is XRP going to go up?Here's the honest problem with that question — anyone who answers it with a confident yes and

Can XRP Reach $1,000? The Math Says No, Here's Why
Every crypto rally brings the same question back: can XRP reach $1,000?It is one of the most-searched price targets in all of crypto, and the short answer is no — not at anything close to XRP's curren