

Understanding Depth Charts
1. What Is a Depth Chart?
2. Basic Components of a Depth Chart
- Horizontal axis (X-axis): Shows order prices, increasing from left to right, and reflects the overall price range in the market.
- Vertical axis (Y-axis): Indicates the order quantity, i.e., the total number of buy or sell orders placed at each price level.
- Green area: Represents the buy side (bids), or the collection of orders willing to purchase at the current price or lower. A larger green area indicates stronger buying pressure.
- Red area: Represents the sell side (asks), or the collection of orders willing to sell at the current price or higher. A larger red area indicates stronger selling pressure.
- Intersection point: Marks the current market price, where buying and selling forces are balanced.
- Price range: Reflects the span of price fluctuations, indicating how much price movement the market is willing to accept.
3. How to Read a Depth Chart
3.1 Assessing Market Depth
- Dense order book with tight spreads: If buy and sell orders are layered closely together at multiple price levels, it indicates better market depth. This means many orders are concentrated near the current price, allowing traders to execute transactions closer to market value and reduce trading costs.
- Thin order book with wide gaps: Conversely, if there are large gaps between order levels, it suggests poor market depth. This indicates fewer orders at certain price levels, so traders may face wider spreads and greater price slippage when executing market orders, leading to higher trading costs.
3.2 Understanding the Balance of Buying and Selling Pressure
- Larger green area: Indicates stronger buying pressure, suggesting the market may be trending upward.
- Larger red area: Indicates stronger selling pressure, suggesting the market may be trending downward.
- Similar areas: Indicates a balance between buyers and sellers, suggesting the market may be in a consolidation phase.
3.3 Example: Interpreting a BTC Depth Chart
4. Three Key Benefits of Understanding Depth Charts
- Lower trading costs: A market with strong depth means a larger number of orders, allowing traders to buy or sell at prices closer to the actual market level, thereby reducing transaction costs.
- Avoid slippage: In markets with poor depth, there may be a large gap between the order price and the actual filled price, leading to slippage. By analyzing the depth chart, traders can anticipate market depth conditions in advance and avoid trading in conditions with high slippage risk.
- Formulate trading strategies: By combining depth chart analysis with the comparison of buying and selling pressure, traders can design more precise strategies. For example, in markets with stronger buying pressure, buying on dips may be favorable; in markets with stronger selling pressure, selling on rallies may be more appropriate.
5. Conclusion
Recommended Reading:
- Why Choose MEXC Futures? Gain deeper insight into the advantages and unique features of MEXC Futures to help you stay ahead in the market.
- MEXC Futures Trading Tutorial (App) Understand the full process of trading Futures on the app and get started with ease.
Popular Articles
View More
ETH/BTC Ratio: What It Means, How It Moves, and Why It Matters
The ETH/BTC ratio is one of the most closely watched numbers in crypto — and for good reason. It tells you, at a glance, whether Ethereum is gaining ground on Bitcoin or falling behind, without ever

Michael Saylor Bitcoin Holdings, Strategy, and Price Prediction Guide
Michael Saylor is one of the most influential — and polarizing — names in Bitcoin today. As the executive chairman of Strategy (formerly MicroStrategy), he has become one of the most prominent

Bitcoin DCA Strategy: How to Dollar Cost Average BTC Like a Pro
For most investors, predicting the right moment to buy Bitcoin has proven consistently difficult. Dollar cost averaging Bitcoin — or DCA Bitcoin — is the strategy that takes that pressure off

Hot Crypto Updates
View More
Strategy Bought the Dip Below Its Own Cost Basis — and Triggered a $504M Short Squeeze
Strategy bought 1,550 BTC at $65,332 — below its own average cost for the first time. Bitcoin rebounded above $63,000 and wiped out $504 million in short positions in 24 hours. Here's what actually

Bitcoin Reclaims $60K: Why This Level Is the Most Important Number in Crypto Right Now
Bitcoin dipped below $60,000 for the first time since Trump's 2024 election win — then clawed back. Here's why this level matters, what the rebound signals, and why BTC's long-term case remains

Bitcoin Crashes Below $66K: $1.86B Liquidated — Perfect Storm or Buying Signal?
Bitcoin crashed to $65,000–$66,000 in 24 hours, triggering over $1.86B in liquidations. Strategy's first BTC sale in 4 years, record ETF outflows, US-Iran tensions, and an AI stock rotation all

Trending News
View More
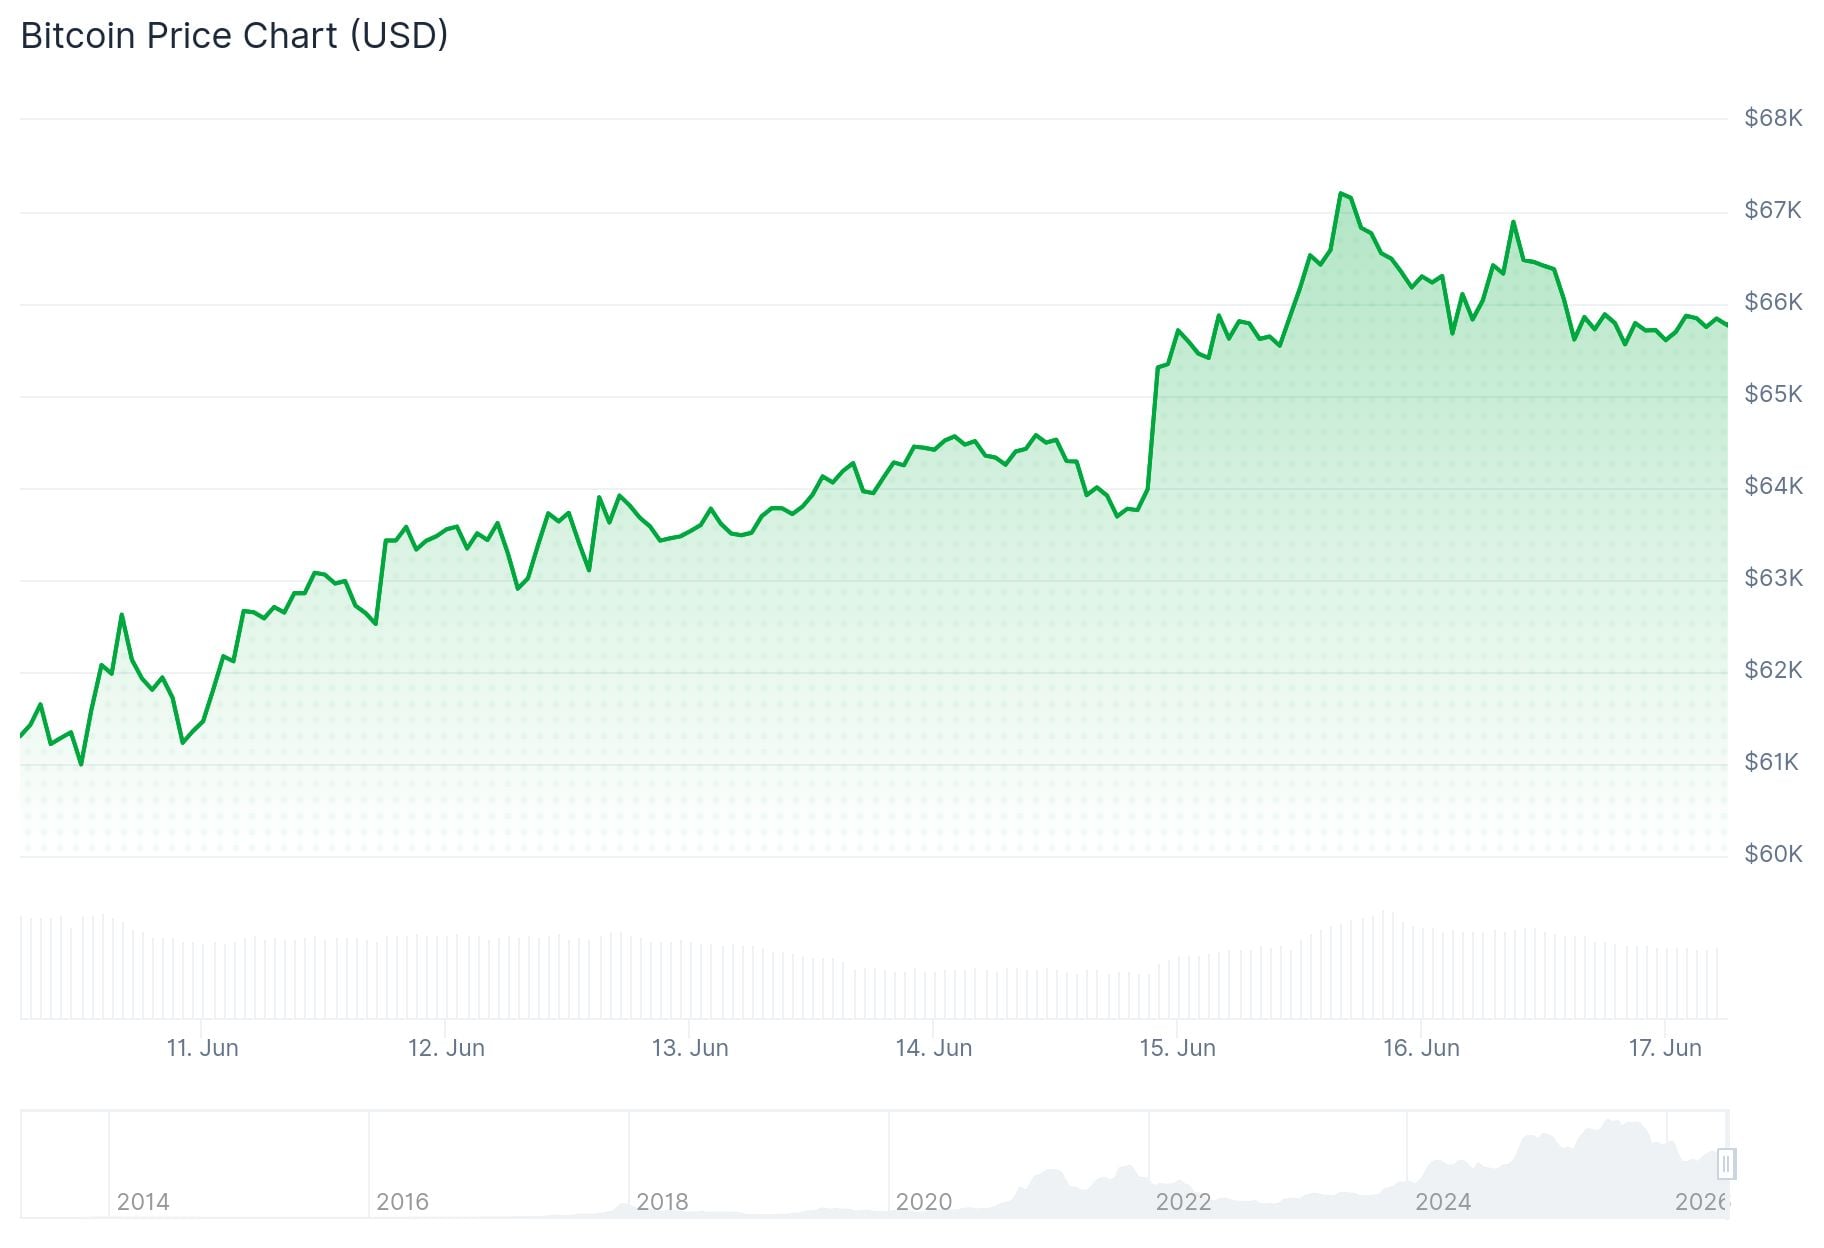
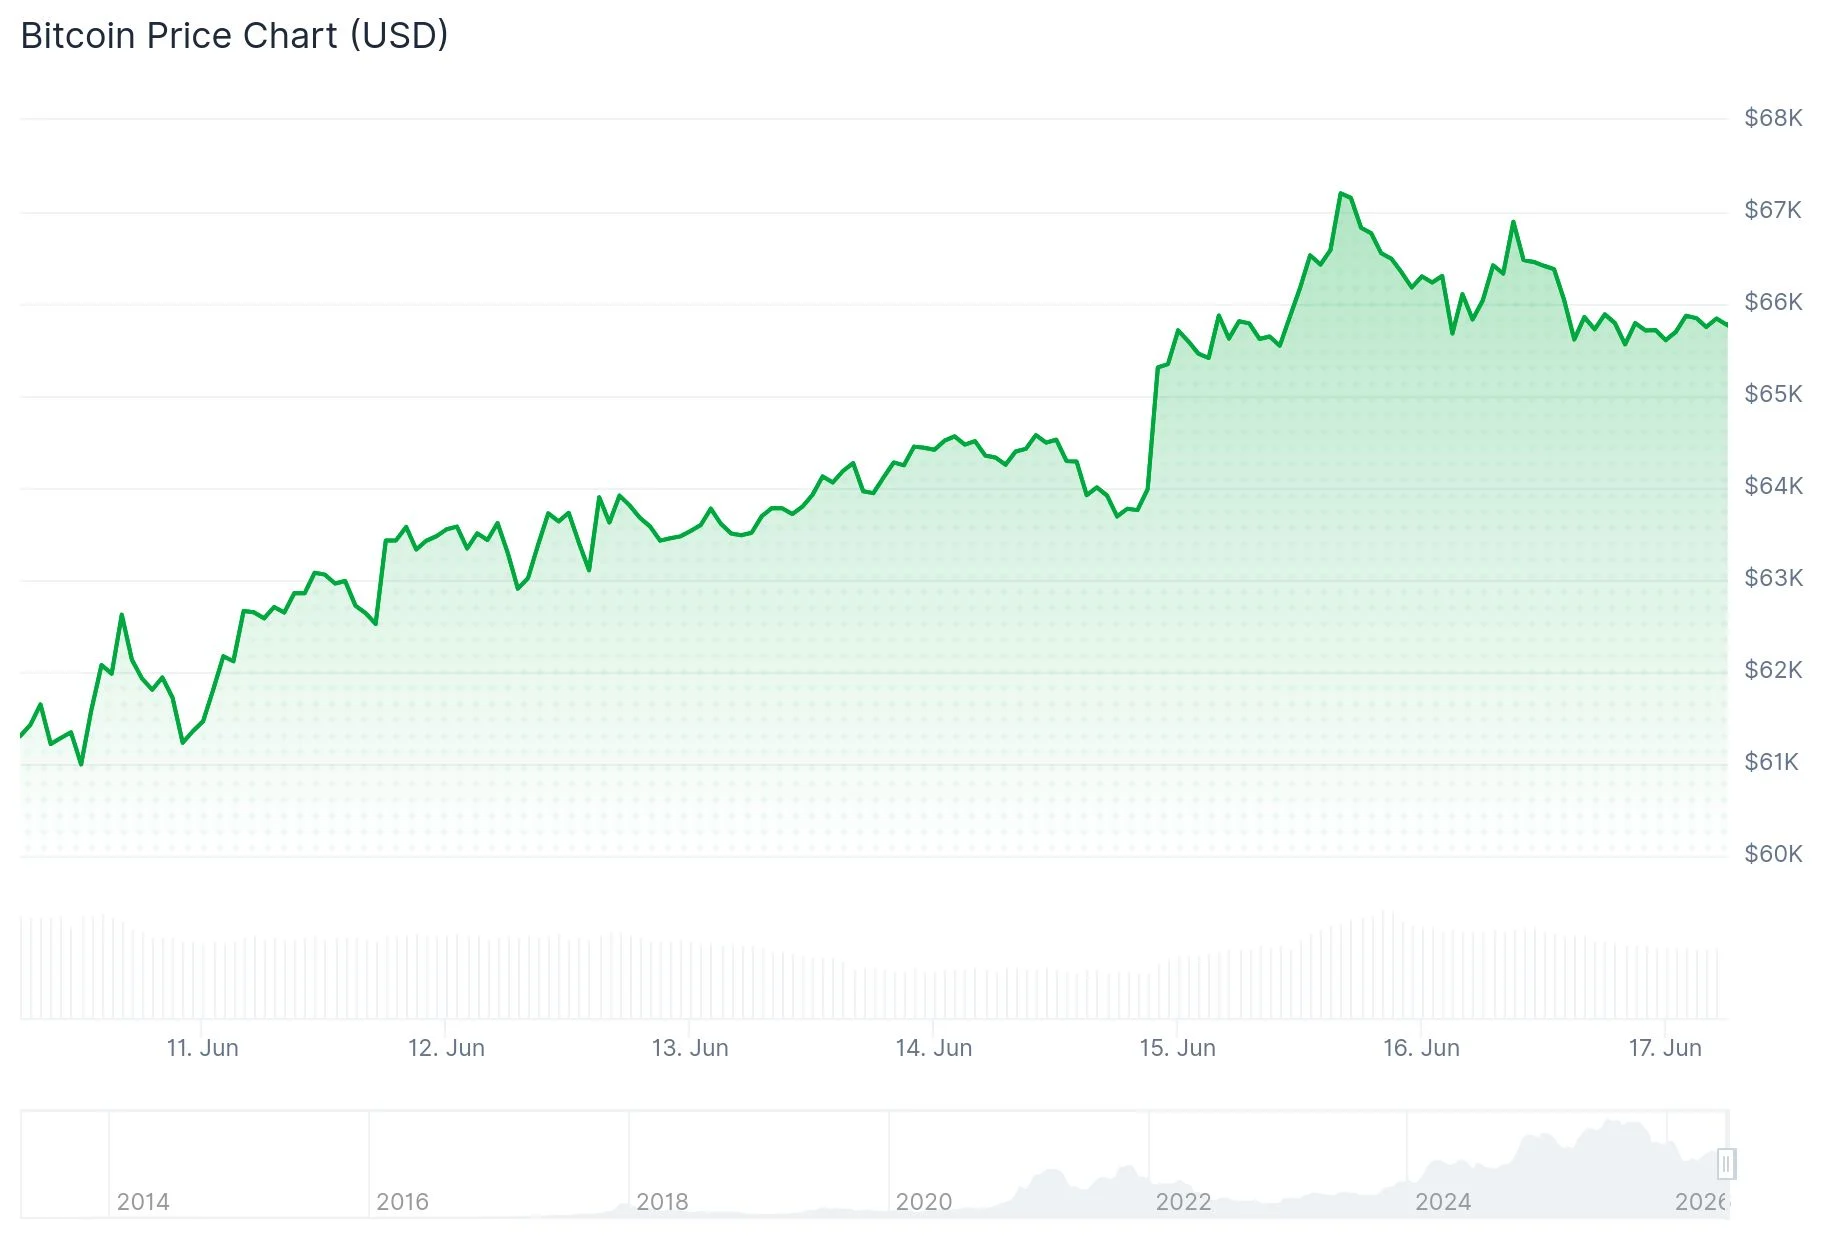
Bitcoin, Ethereum, and XRP Price Forecast Today
The post Bitcoin, Ethereum, and XRP Price Forecast Today appeared first on Coinpedia Fintech News Bitcoin (BTC) is consolidating near the $66,000 level after a
STG up +24.92%, BTC -0.34%, SPX6900 is The Coin of The Day - Daily Market Update for Jun 17, 2026
Today's top gainer is Stargate Finance with a +24.92% price increase. Bitcoin down by -0.34% in the last 24 hours. The coin of the day is SPX6900. The total market
Related Articles
View More
The Complete Guide to Coin-M Perpetual Futures on MEXC
In cryptocurrency derivatives, Futures trading enables investors to apply leverage to increase potential returns and to take positions in both rising and falling markets. MEXC offers two primary types
What is MEXC Futures Earn?
1. What is MEXC Futures Earn?Futures Earn is a financial product offered by MEXC for Futures users. Once activated, eligible funds in your Futures account will automatically enroll in this exclusive E

MEXC AI Strategy for Beginners: How AI Quant Trading Works
Key Takeaways:MEXC AI Strategy is officially live, allowing users to generate futures trading strategies using natural language, making it easy for beginners to get started. It integrates social media


