

This Forgotten Litecoin (LTC) Price Zone Could Be the Catalyst for a $100 Move
At a glance, the weekly chart shared by Erick Crypto tells a pretty straightforward story. The LTC price is still hanging out in the same support zone it’s been defending for years.
With Litecoin trading around $59, the price is right in that $55–$60 area that keeps showing up as a line buyers are willing to protect. This isn’t some new level that just formed last week. It’s a zone that’s been tested through multiple market phases, which is why it’s starting to matter again.
Years of Sideways Action in LTC Are Starting to Add Up
On the chart shared by Erick, it becomes clear how long Litecoin has been stuck in this range. After topping out in 2021 and unwinding through 2022, the LTC price has spent most of the last couple of years chopping sideways. Rallies fade, dips get bought, and price keeps circling back to the same area.
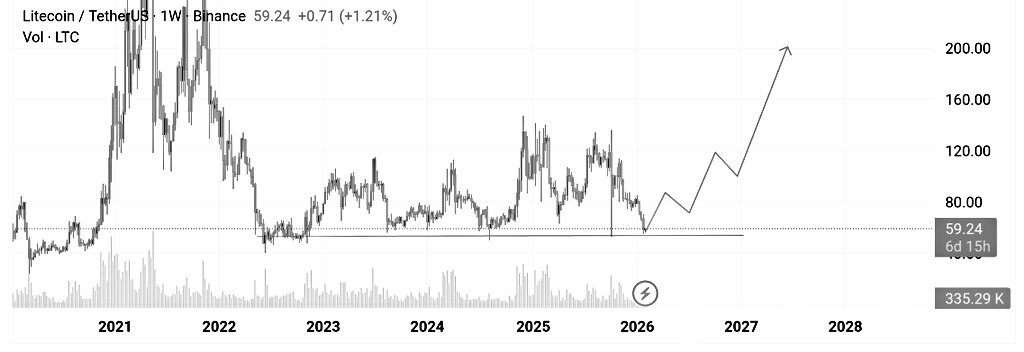 Source: X/@ErickCrypto21M
That kind of action can feel frustrating, but it usually isn’t random. Sellers have had plenty of chances to push Litecoin lower, and they haven’t been able to do it in a lasting way.
At the same time, buyers haven’t been strong enough to force a breakout either. What you end up with is a long base that quietly gets stronger the longer it holds support.
Why This Support Zone Keeps Getting Defended
The $55–$60 range has basically become the market’s decision point. Every time the LTC price slips into that area, selling pressure starts to ease and buyers step in. Just as important, price hasn’t been able to collapse below it and stay there.
Above this zone, there’s still plenty of overhead supply. That’s why every bounce so far has stalled and rolled over. But that repeated back-and-forth is often how accumulation plays out before a bigger move.
Read Also: Litecoin (LTC) Price Cracks a 9-Year Floor – Here’s Why This Breakdown Matters
What a Move Higher Could Look Like for Litecoin
If this base keeps holding, the next phase probably doesn’t start with fireworks. It starts with Litecoin finally pushing above familiar resistance levels and holding them. If that happens, the chart opens up toward the $100–$120 range as a reasonable mid-term area to watch.
On a much higher timeframe, the old cycle highs near $180–$200 come back into view if the market enters a broader expansion phase. Those levels aren’t immediate targets, but they exist on the chart for a reason.
For now, the LTC price isn’t breaking down or breaking out. It’s doing the boring but important work of holding support. As long as that floor stays intact, the structure remains constructive. The real question is whether Litecoin can finally turn this long period of waiting into the start of something bigger.
Subscribe to our YouTube channel for daily crypto updates, market insights, and expert analysis.
The post This Forgotten Litecoin (LTC) Price Zone Could Be the Catalyst for a $100 Move appeared first on CaptainAltcoin.
추천 콘텐츠

Polymarket Temporarily Barred from Nevada as Legal Fight Escalates

The Revolutionary MacOS Launch That’s Transforming Agentic Coding Forever
