

Q4 2025: Bitcoin Posts Worst Quarterly Loss Since 2018
The final quarter of 2025 has turned out to be the worst-performing quarter for Bitcoin in nearly a decade.
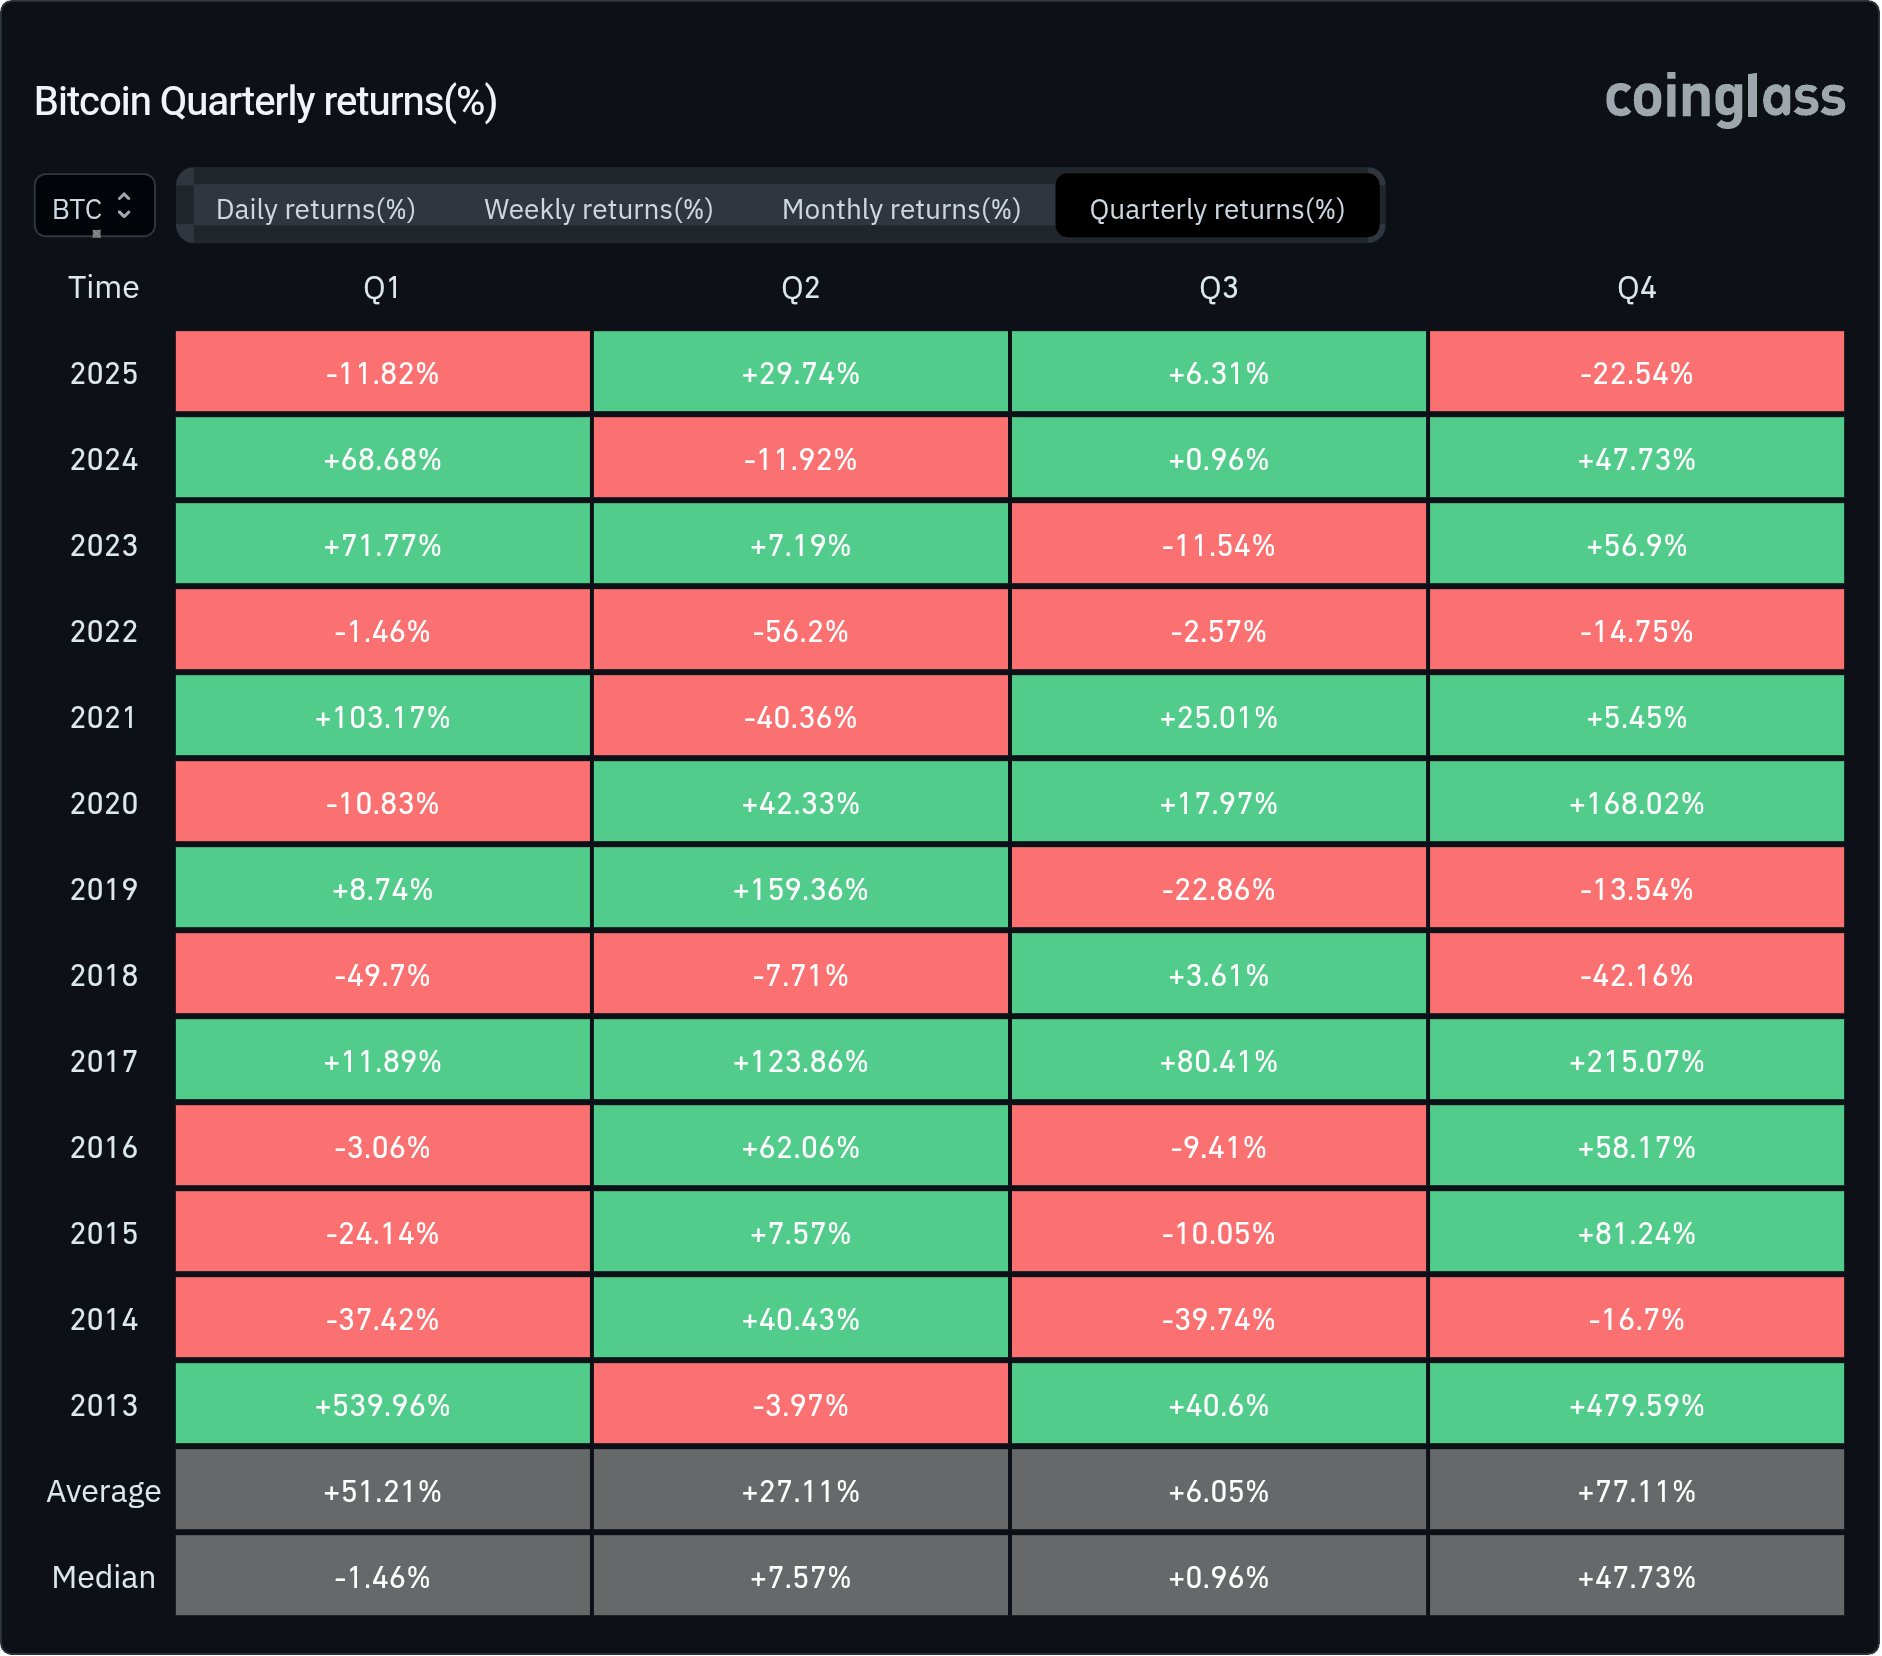
Data from Coinglass confirms that Bitcoin has registered a loss of 22.54% so far in the fourth quarter of 2025, with just a week remaining until the end of the year. The last time Bitcoin experienced such a massive negative performance in Q4 was in 2018, when it ended the year with a Q4 loss of 42.16%.
This is evident in the ongoing bearish performance the market has seen since Bitcoin hit a peak in October this year. Specifically, since October’s $126,198 peak, Bitcoin has declined 30.82% to $87,201.
Bitcoin’s price dip has wiped out over $1 trillion from the global crypto market valuation, falling from over $4.1 trillion a few months ago to $2.91 trillion today.
Bitcoin Worst Quarter Since 2018
Historically, the last quarter of the year is a bullish phase for Bitcoin, with an average gain of 77.11% and a median gain of 47.73%. Since 2013, Bitcoin has posted positive gains in Q4 eight times, with increases as high as 479.59% and as low as 5.45%. It has only registered losses five times, including Q4 2025.
Notably, after Bitcoin dipped 42% in Q4 2018, it saw a recovery in Q1 2019, posting gains of 8.74%. This set the stage for a more massive 159.36% gain by Q2 that year. However, Bitcoin registered a 22.86% loss in Q3 and a 13.54% loss in Q4 of 2019.
This marked another fourth-quarter loss for Bitcoin. The loss carried into 2020, with another 10.83% dip in Q1. From then on, a major recovery followed, with Bitcoin registering outstanding positive gains of 42.33%, 17.97%, and an even more massive 168.02% in Q2, Q3, and Q4, respectively.
 Bitcoin historical chart from Coinglass
What Could Happen in Q1 2026?
As it stands, this historical account suggests two possible outcomes for Bitcoin:
It could see a relief in Q1 2026, consistent with recoveries after Q4 losses in 2018 and 2022. Notably, after Bitcoin dipped 14.75% in Q4 2022, it registered a massive 71.77% upside in Q1 2023.
Alternatively, Bitcoin could see another loss in Q1 2026, consistent with its performance after the Q4 2019 loss. However, that loss paved the way for explosive gains in Q2, Q3, and Q4. In other words, should Q1 2026 end bearish for Bitcoin, a rebound could follow for the rest of the year.
What Industry Experts Expect in 2026
According to Citibank, Bitcoin could reach as high as $189,000 in 2026 under an ultra-bullish scenario. It could also reach $143,000 under a moderate scenario, both of which would mark new all-time highs for BTC.
Notably, Bernstein analysts have similar expectations, suggesting BTC could reach $150,000 in 2026 and $200,000 in 2027.
추천 콘텐츠

Ripple inches closer to full MiCA license to expand across EU via Luxembourg
XRPL Validator Reveals Why He Just Vetoed New Amendment
