

Ethereum Price Nears Big Move as Spot ETFs Record a Big Weekly Outflow
Key Insights
- Ethereum price is nearing a major move as ascending triangle pattern forms.
- The token’s fundamentals are deteriorating as ETH outflows rise.
- The total value locked (TVL) in is platform has continued falling.
Ethereum price has moved sideways in the past few weeks, with the recent rally that happened in April stalling. The token was trading at $2,300 on Saturday, slightly lower than last month’s high of $2,430. Technicals suggest that it may stage a strong comeback in the coming days despite the falling ETF inflows.
Ethereum Price Technical Analysis Suggests a Big Move is Coming
The daily timeframe chart shows that the Ethereum price has been in a slow uptrend in the past few weeks as it rose from a low of $1,750 in February to the current $2,300.
This chart shows that the token stalled at the important $2,500 resistance level, which coincided with the 23.6% Fibonacci Retracement. It also coincided with a key resistance level that connects the highest swings in April and May this year.
Ethereum price has moved slightly above the 50-day Exponential Moving Average (EMA), signaling that bulls are regaining control.
However, the Relative Strength Index (RSI) has dropped from 65 on April 17 to the current 53. Also, the Average True Range (ATR) and the Average Directional Index (ADX) have slipped.
Therefore, the falling volatility, together with the forming ascending triangle pattern points to an eventual rebound, potentially to the 38.2% Fibonacci Retracement level at $2,973. A move above that price will signal further gains, potentially to the 50% retracement level at $3,360.
On the flip side, a drop below the key support level at $2,000 will invalidate the bullish outlook and signal further downside.
 ETH price chart | Source: TradingView
Technicals May Prevail as Fundamentals Disappoint
The potential bullish Ethereum price prediction is happening despite the ongoing weakening fundamentals.
One of the worsening fundamentals is the fact that demand for Ethereum ETFs has faded in the past few weeks.
SoSoValue data shows that these ETFs had their first weekly outflow in four weeks. They shed over $82 million this week after adding $155 million and $275 million in the previous two consecutive weeks.
In total, these funds now hold $12 billion in assets, with BlackRock’s ETHA being the most dominant player with over $7.2 billion in assets. The two Grayscale funds, ETH and ETHE follow it closely with over $2.09 billion and $1.88 billion in assets, respectively.
The falling ETF inflows is a sign that demand from institutional investors continues to weaken, implying a potential retreat. Still, on the positive side, the outflows could be a sign that the trend has taken a breather.
The other major risk is that Ethereum Treasury companies are no longer buying. Data compiled by CoinGecko shows that only Tom Lee’s BitMine is buying these tokens. It has bought 346k tokens in the last 30 days, bringing its board to 5.078 million tokens.
Other top companies in the industry, like SharpLink, The Ether Machine, and BitDigital, have not made any purchases in the past few months. In the past, these companies were among the biggest drivers of demand for the coin.
Meanwhile, the Ethereum price has struggled because of the ongoing weakness in its network, which has led to lower fees. Data shows that the total value locked (TVL) in its decentralized finance (DeFi) ecosystem has dropped substantially in the past few weeks.
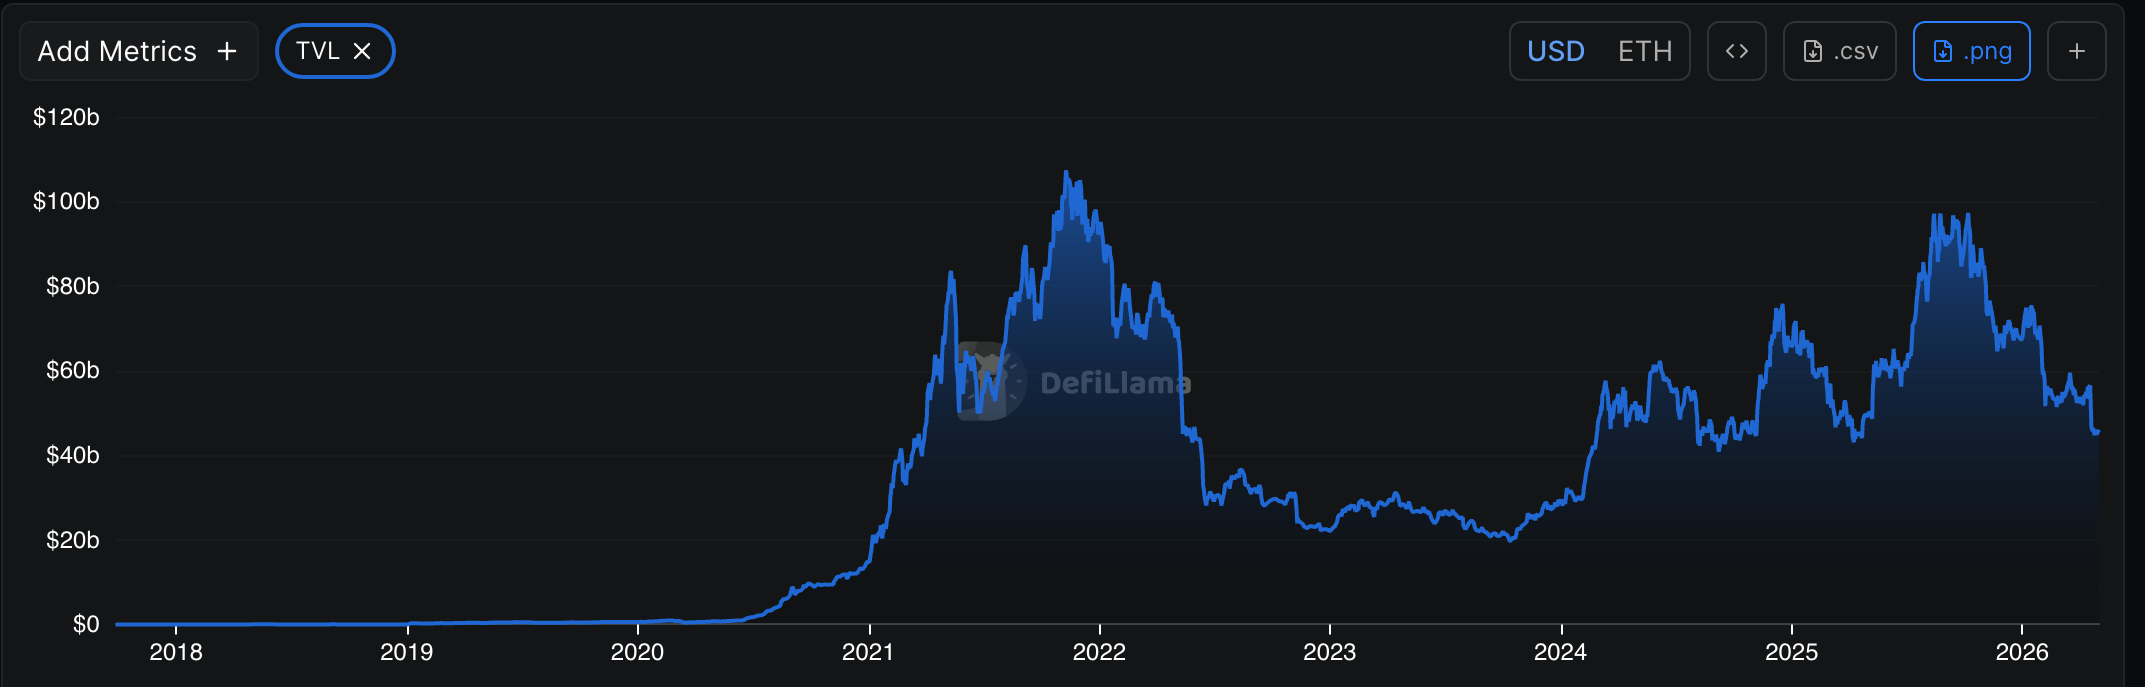 Ethereum DeFi TVL : Source: DeFi Llama
Ethereum’s TVL has dropped to $46 billion, down from last year’s high of $93 billion. The decline in the TVL accelerated after the recent KelpDAO hack. Aave, which ks is the biggest player in its ecosystem, lost billions in assets and had to be rescued by the DeFi United, which raised millions of dollars.
All this has led to lower network fees. Ethereum collected less than $30 million in fees in April, far below Hyperliquid’s total for the same month.
The post Ethereum Price Nears Big Move as Spot ETFs Record a Big Weekly Outflow appeared first on The Market Periodical.


추천 콘텐츠

Pi Network V23 Upgrade May Trigger Major Exchange Listings

AI predicts XRP price for April 30, 2026


