

Solana (SOL) Price: Analysts Say SOL Is Coiling for Its “Most Powerful Move” in Two Years
TLDR
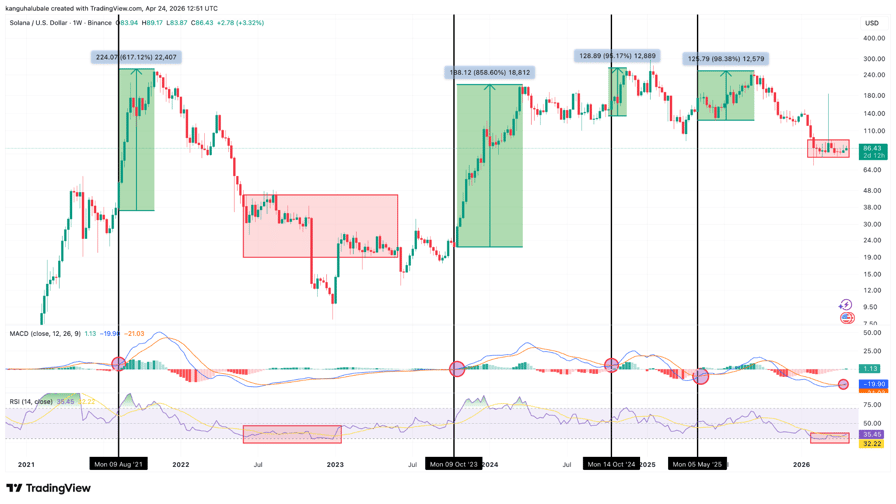
- Solana’s weekly MACD indicator has flashed a “buy” signal, which previously preceded rallies of 100% to 860%
- The RSI has recovered to 35 from 25 in mid-February, matching levels seen at Solana’s 2022 bear market bottom
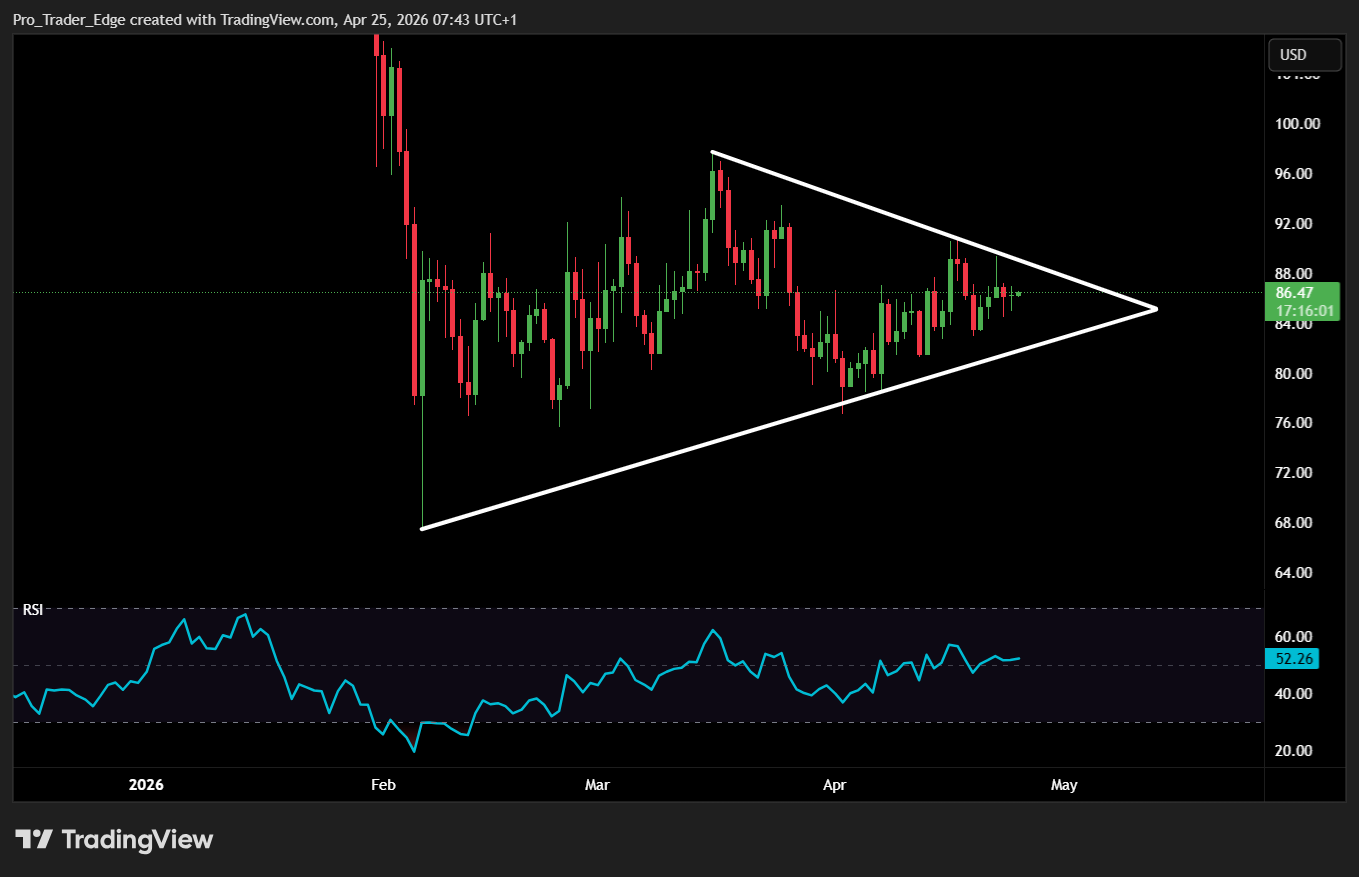
- A symmetrical triangle pattern on the daily chart points to a breakout target of $130
- Key resistance sits at $90–$96, where around 9.9 million SOL are held at an average cost of $90–$92
- Analyst Ali Charts flagged a Bollinger Band squeeze on the 3-day chart, calling $77–$94 a “no-trade zone”
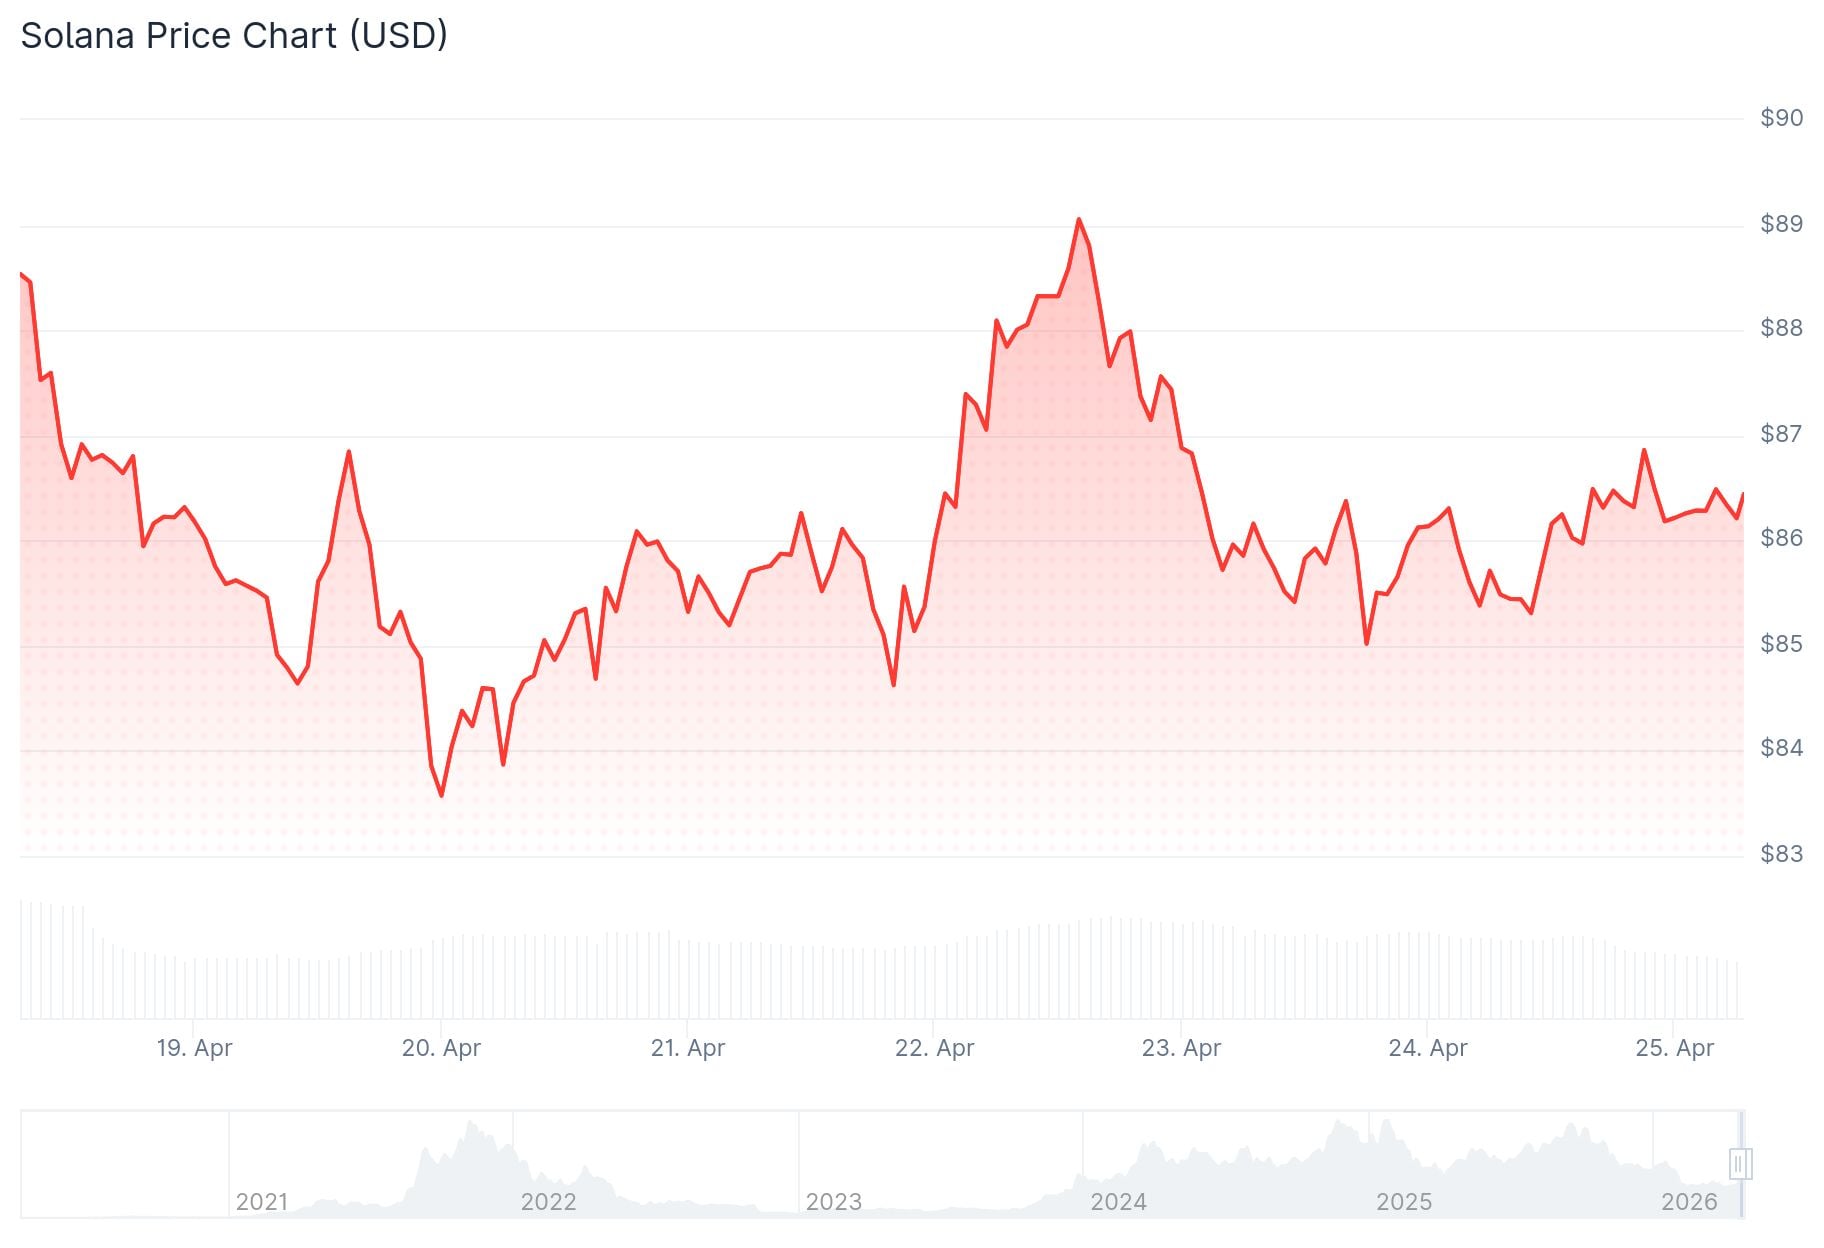
Solana’s (SOL) weekly chart has produced a MACD “buy” signal — the same signal that preceded major price rallies in previous cycles. The token is currently trading around $85–$86 after pulling back from a weekly high of $89.
 Solana (SOL) Price
The MACD line crossed above the signal line on the weekly chart. This is the same crossover that appeared in May 2025, before SOL climbed from around $125 to above $250, a gain of roughly 100%.
In earlier cycles, similar signals came before gains of 860% in 2023 and 617% in 2021.
 Source; TradingView
The RSI on the weekly chart has also moved to 35, up from 25 in mid-February. That level matches where SOL’s RSI sat at the bottom of the 2022 bear market, which was followed by a 2,500% rally to $210 by March 2024.
Analyst Tyler Hill noted that Solana’s RSI had dropped to sub-35 levels for the first time in 1,200 days. He said the last time it reached those levels, it marked the bear market bottom and preceded a 3,000% price rally.
Analyst Sixtysecondalpha said the MACD cross came after its “lowest stretch ever.” Combined with bullish RSI divergence, they said SOL was set up for its “most powerful move” in two years.
$130 Breakout Target in Play
On the daily chart, SOL has formed a symmetrical triangle pattern. The breakout level sits at $90. If the price closes above that level, the measured target from the pattern is approximately $130, around 50% above current prices.
 Source: TradingView
The daily RSI has climbed to 52 from an oversold reading of 11 on February 6, pointing to improving momentum.
$90 Resistance Remains the Key Hurdle
The $90–$96 zone presents a clear challenge. Around 9.9 million Solana are held by investors at an average cost of $90–$92, according to Glassnode data. Many of those holders may sell at break-even, which could slow or stall any rally.
The 100-day moving averages also converge in that zone, adding further technical resistance.
Analyst Ali Charts pointed to a Bollinger Band squeeze forming on the 3-day chart, with price compressed between $77 and $94. Ali Charts called this range a “no-trade zone” and said traders should wait for a clean 3-day candle close outside the bands before acting.
SOL is currently holding the $85–$86 range as bulls continue attempting to reclaim the $90 level.
The post Solana (SOL) Price: Analysts Say SOL Is Coiling for Its “Most Powerful Move” in Two Years appeared first on CoinCentral.


추천 콘텐츠

Tucker Carlson criticizes Trump, Polymarket sees 100% chance of Trump insult

Phillies Boss Makes Rare Early-Season Move With Season In Crisis


