

Ethereum’s 4 consecutive weeks of price rallies fuel bullish bets of $3200
Ethereum traders are rebuilding bullish exposure to the second-largest cryptocurrency, with derivatives markets showing renewed demand for upside bets.
According to CryptoSlate's data, ETH has gained about 11% this month on the back of a four-week stretch of gains, its longest in nearly a year.
This uptrend pushed ETH to around $2330, its highest price level since February, and puts it on course for its first back-to-back monthly advance since July and August 2025.
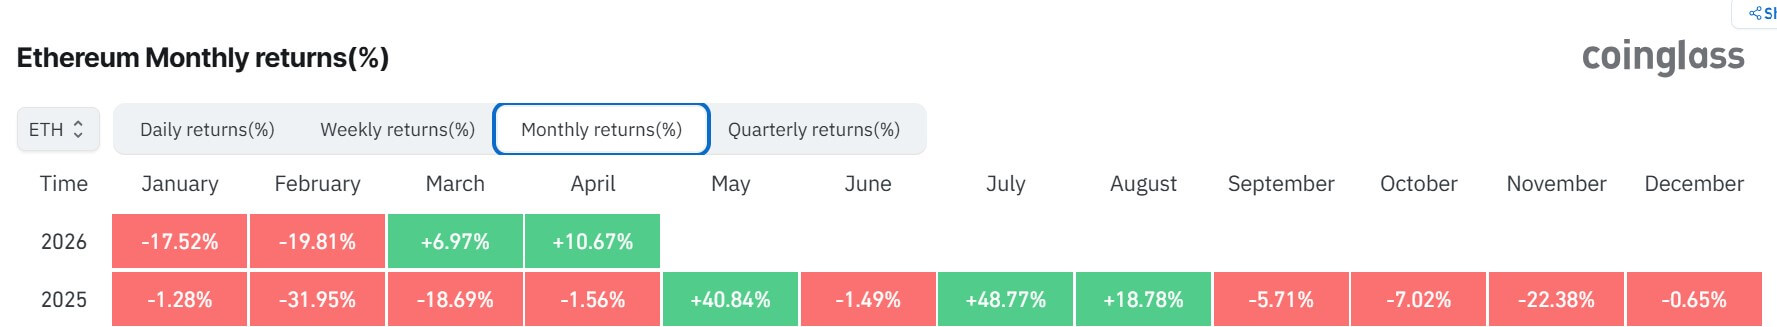 Ethereum Price Monthly Returns Since January 2025 -April 2026 (Source: CoinGlass)
As a result, ETH's price performance has shifted the market attention back to the $3,000 level after months of weaker relative performance against Bitcoin.
Ethereum options trader position for $3,200
Deribit, the largest crypto options venue, has become the clearest expression of the renewed upside trade.
Data from the trading platform show that open interest in ETH call options has built up around the $3,200 strike, with more than $322 million in outstanding contracts. The $2,500 strike option follows closely with roughly $320 million in open interest.
Call options give traders the right to buy an asset at a set price. They typically gain value as the underlying token moves closer to the strike.
In ETH's case, the concentration around $2,500 and $3,200 shows that traders are again positioning for a move beyond the current recovery range.
Meanwhile, the large open interest does not mean every position is a direct bullish bet. Options activity can include hedging, spread trades, volatility strategies, and market-maker exposure.
ETH ETF flows register longest inflow streak this year
US spot Ethereum exchange-traded funds (ETFs) recently delivered one of the strongest demand signals ahead of the rally, which then paused.
Data from SoSo Value showed that the 10 funds drew more than $633 million during a 10-day inflow streak that began on April 9 and ended on April 22. This is their longest inflow streak of this year and the longest since June 2025.
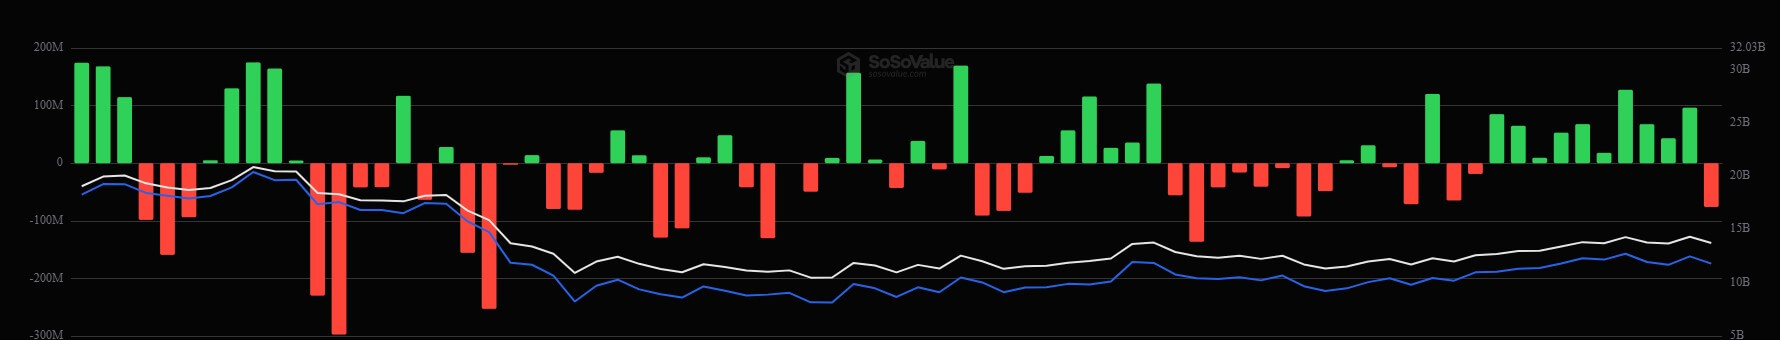 Ethereum ETFs Daily Flows in 2026 (Source: SoSoValue)
However, the current inflow streak ended on April 23, when the funds recorded $75.94 million in net outflows, marking their first negative session since early April.
Still, the inflow streak helps support the view that regulated investors were returning to Ethereum exposure after months in which Bitcoin attracted the larger institutional bid. ETF flows are closely watched because they show demand through spot products rather than leveraged positions on derivatives venues.
Alphractal data corroborated the trend and pointed out that its Ethereum Smart Money Flow Index, a proprietary measure of institutional activity in ETH, has also shown positive divergence from price for several weeks.
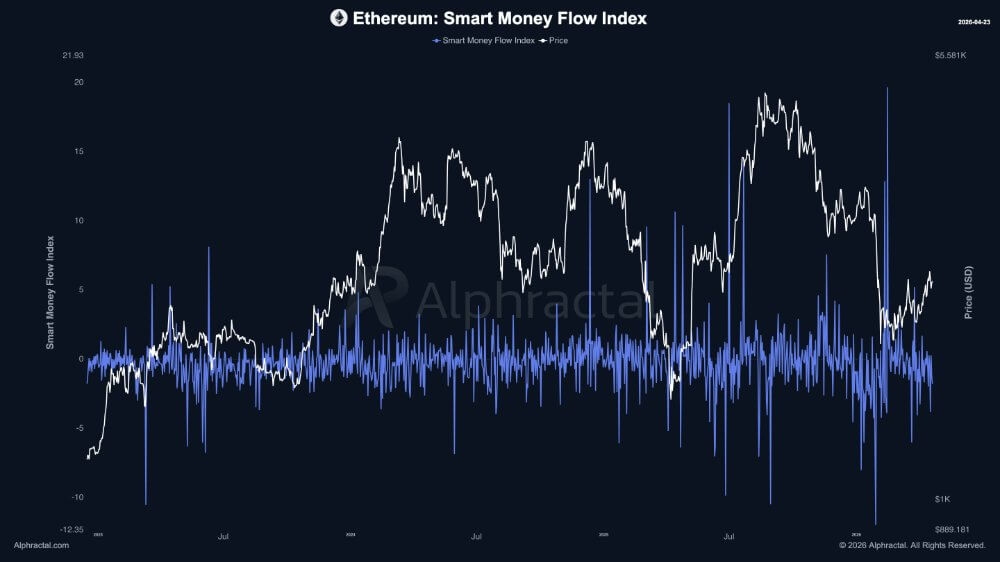 Ethereum Smart Money Flow Index (Source: Alphractal)
That suggests fund demand had been improving before the recovery became more visible in spot prices.
However, the latest outflow tempers that reading as it shows that Ethereum has not yet shown the same ETF-led consistency that has supported Bitcoin during stronger rallies.
For ETH, the fund-flow picture is improving, but it has not yet become strong enough to carry the market on its own.
Buyers are gradually returning to the market
Apart from the sustained inflows from the ETFs, Binance order-flow data also points to a gradual improvement in demand rather than aggressive accumulation.
CryptoQuant's data show that the exchange’s Cumulative Volume Delta (CVD) recently registered a positive reading of about 48,400. CVD tracks the net difference between buying and selling volume. A positive reading means buy orders are outweighing sell orders.
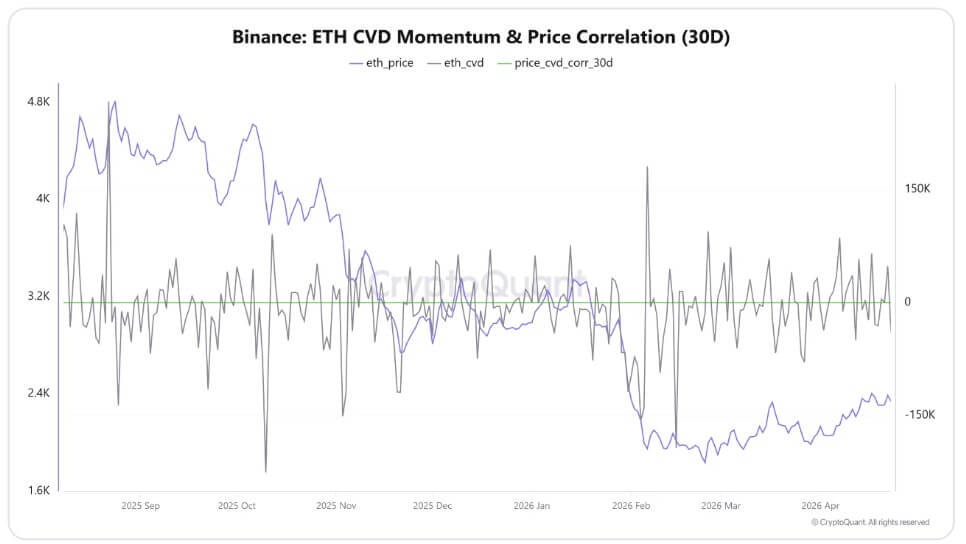 Ethereum Volume Momentum (Source: CryptoQuant)
This suggests ETH is not rising solely due to the increased speculative leverage but because buyers have returned to the market, which has helped the token stabilize after earlier declines.
Meanwhile, the relationship between ETH's price and order flow has also strengthened. The correlation coefficient was 0.66, indicating a moderately strong relationship between buying activity and price movement.
However, the signal remains measured because ETH is still trading below prior highs, and the CVD reading does not show the type of forceful spot accumulation usually associated with a confirmed breakout. Instead, it points to a rebalancing phase after a weaker stretch.
That leaves a sustained ETH uptrend dependent on whether the improvement in order flow continues.
A stronger CVD reading would support the case that spot buyers are validating the move shown in options and ETFs. A stall would leave the rally more exposed to speculative positioning.
ETH's leverage is rising
Despite these bullish metrics, CryptoQuant data from Binance shows the main source of risk behind the ETH rally.
The exchange’s leverage ratio has climbed above the price for the first time in months. When leverage expands faster than spot price gains, it indicates traders are adding borrowed exposure more quickly than investors are buying the token outright.
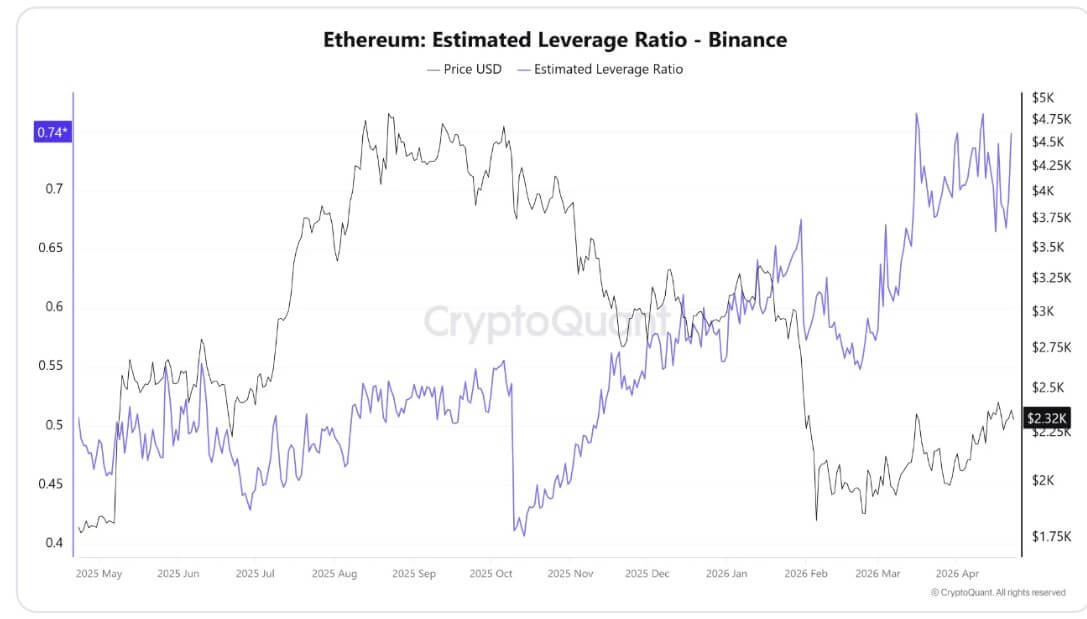 Ethereum Leveraged Ratio (Source: CryptoQuant)
That pattern can appear during early recoveries, when traders try to position ahead of a breakout before spot flows fully confirm the move.
Notably, this can support fast gains while market conditions remain favorable. It can also increase the risk of forced selling if the price reverses.
However, leveraged positions are more sensitive to moves against them. If ETH fails to hold recent gains, long positions can be liquidated, adding sell pressure to the decline.
This leverage signal sits against a more constructive set of indicators. Ethereum has posted four straight weekly gains, Deribit traders are targeting higher strikes, ETFs recently recorded a 10-day inflow streak, and CVD shows buy orders outweighing sell orders.
The risk, however, is that those signals are not moving at the same speed.
This is because ETH's move toward $3,200 would need those gaps to narrow. Spot buyers would need to keep absorbing supply, ETF flows would need to stabilize, and leverage would need to stop rising faster than price.
Without that confirmation, the same derivatives exposure supporting the rebound could amplify losses during a failed breakout.
The post Ethereum’s 4 consecutive weeks of price rallies fuel bullish bets of $3200 appeared first on CryptoSlate.


추천 콘텐츠

UK FCA May Exempt Crypto Firms from Key TradFi Rules — What’s at Stake?

Solana Foundation backs Aave recovery with first-ever USDT deployment, plans to bring AAVE to Solana


