

Ripple Price Prediction: Why XRP Is Lagging Hard—And What It Must Do to Catch Up
While Bitcoin is at $77k and climbing, XRP is trading at $1.43, roughly where it has been over the last three months.
The altcoin’s inability to participate in one of the market’s most sustained recovery phases raises a legitimate question: is XRP facing a temporary lag, or is something more structural at play in its relative performance?
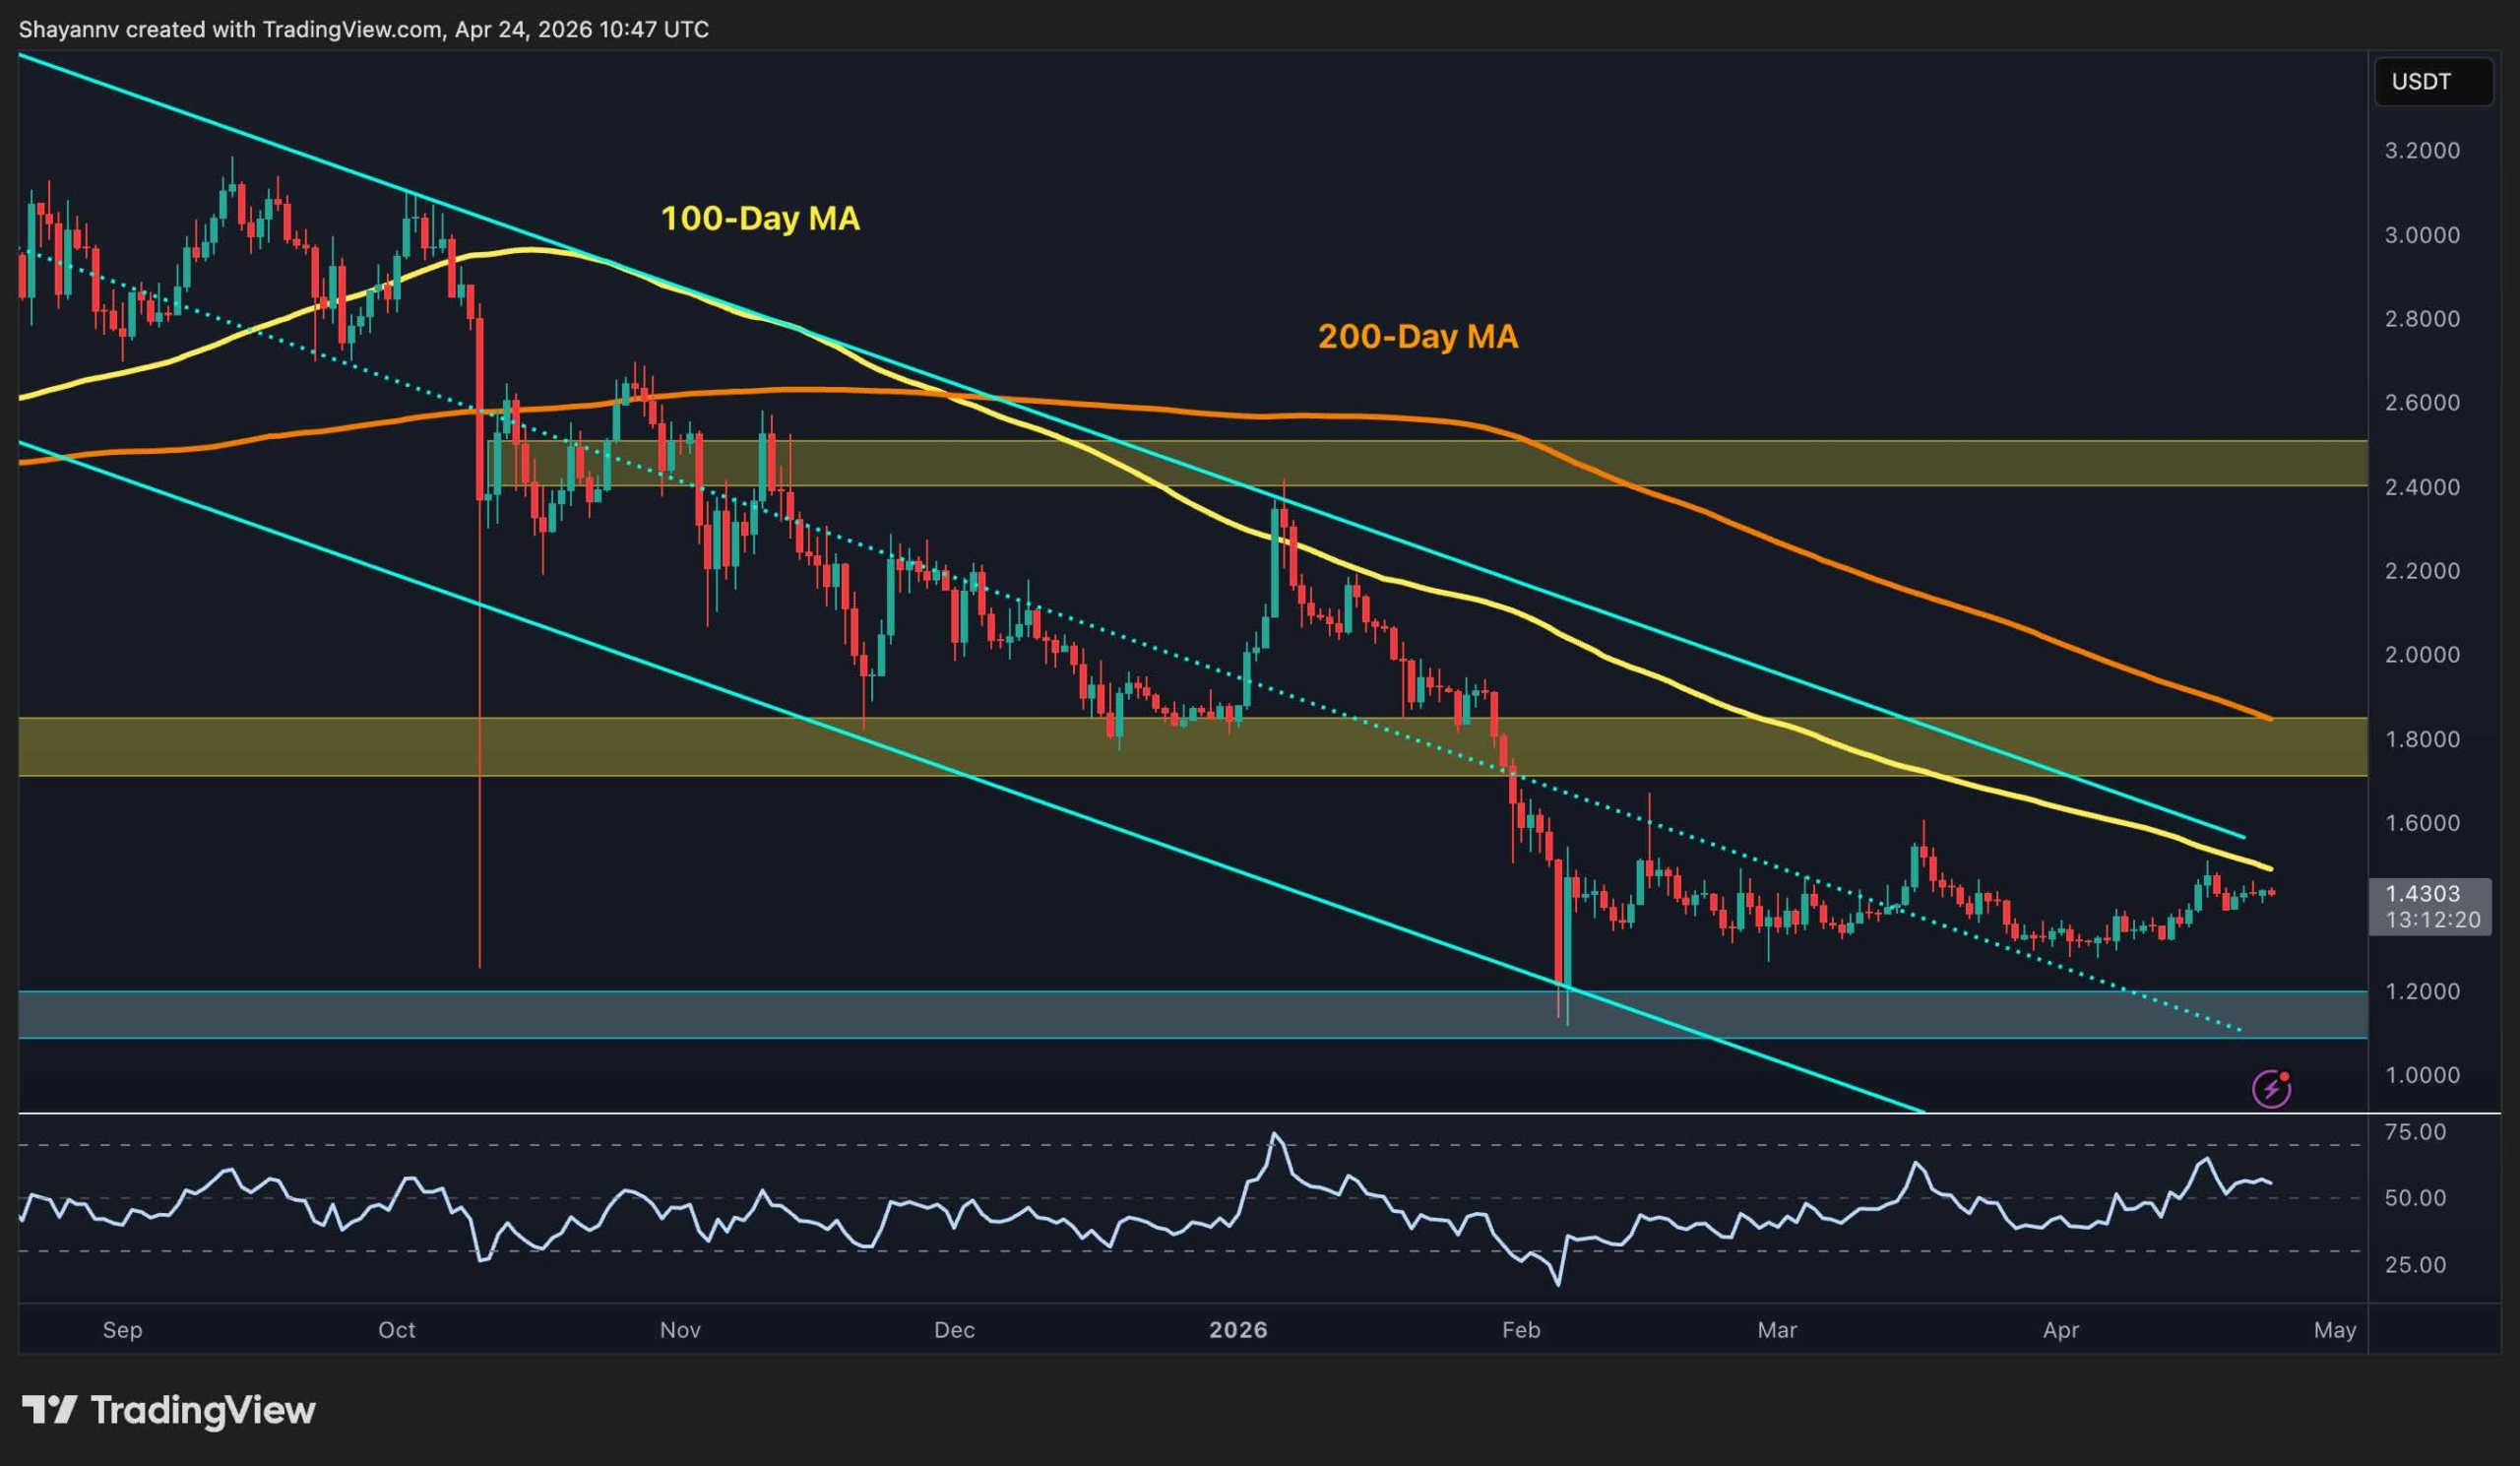
Ripple Price Analysis: The USDT Pair
The descending channel that has contained XRP since the late 2025 peaks remains unbroken, and the distance between the current price and any meaningful resistance continues to make the recovery thesis a difficult one to argue. The 100-day moving average has now declined to approximately $1.50, and the 200-day moving average sits near $1.80.
Both are still falling but have yet to be decisively tested by price.
What has changed modestly is the RSI, which has recovered from the deeply oversold levels seen in February and is now hovering above 50, which is the strongest sustained reading since before the bear market started. That is a marginal positive, but it needs to translate into actual price reclamation to mean anything. The $1.80 supply zone remains the primary level that would alter the narrative, requiring a move of over 20% from the current price just to reach what would still be a resistance level inside the broader downtrend.
Below, $1.20 is the final structural defense before the $1.00 psychological level comes into view.
 Source: TradingView
The BTC Pair
If the USDT chart is disappointing, the BTC pair is actively alarming. XRP/BTC is trading at approximately 1,840 sats, which is a fresh multi-month low that is pushing toward levels not seen since before the previous bull run began.
Bitcoin has broken its descending channel, reclaimed its 100-day MA, and is building toward $80k. XRP, against that same Bitcoin, is making new lows.
The 100-day MA (~2,000 sats) and 200-day MA (~2,200 sats) are both declining overhead and have not been seriously challenged since early 2026. The RSI is also hovering around 40. It is not oversold enough to force a bounce, and at the same time, not strong enough to suggest a momentum shift.
The next support level below the current price is 1,800 sats (February capitulation low), with the lower boundary of the trendline as the lowest potential turning point around 1,600 sats. Until XRP can reclaim 2,000 sats and hold above it, any dollar-denominated gains are likely to be BTC-denominated losses, and that is the metric that matters most for gauging whether XRP is genuinely recovering or simply being carried by the tide.
 Source: TradingView
The post Ripple Price Prediction: Why XRP Is Lagging Hard—And What It Must Do to Catch Up appeared first on CryptoPotato.


추천 콘텐츠

Next Block Expo 2026 in Warsaw Brings Institutional Focus to Crypto

This ChatGPT portfolio just outperformed the entire stock market within weeks


