

XRP Price at Bottom Signal: Will History Trigger a Breakout?
Key Insights:
- XRP price RSI hit its lowest level since Oct. 2025.
- XRP price MVRV Z-score neared historical bottom zone.
- Ripple held a key support range amid weak momentum.
XRP price remained under pressure after months of decline. Yet, recent data pointed to a possible reversal.
TradingView data showed that the XRP-to-Bitcoin ratio reached deeply oversold levels. At the same time, on-chain indicators aligned with past market bottoms. This shift occurred as broader crypto markets struggled to regain momentum.
Market sentiment stayed cautious, but historical patterns suggested a turning point could be forming. XRP price moved within a prolonged consolidation structure.
It previously acted as a base before strong upward cycles. That reaction mirrored earlier phases where extended weakness preceded sharp recoveries.
XRP Price Momentum Shows Extreme Oversold Conditions
TradingView data revealed the relative strength index of the XRP/BTC pair dropped to 24, its lowest level in months. Such readings marked rare oversold territory, which historically aligned with cycle bottoms. The move followed a prolonged eight-month downtrend that eroded bullish momentum.
 BTC/XRP price chart | Source: TradingView
Past instances showed similar RSI levels triggered strong recoveries in the XRP price relative to Bitcoin.
In late 2024 and mid-2025, comparable conditions preceded rallies ranging between double-digit and triple-digit percentage gains. Those rebounds emerged after extended consolidation phases, where sellers exhausted their positions.
The XRP/BTC pair also traded within a wide horizontal range that acted as a launchpad in previous cycles.
That structure indicated accumulation behavior rather than continued distribution. This pattern suggested that market participants gradually built positions during periods of low volatility.
XRP Price Onchain Metrics Signal Accumulation Zone
Glassnode data showed the MVRV Z-score hovered near zero, a level tied to accumulation phases. This reading indicated most holders approached their cost basis, which reduced the incentive to sell. The move followed a broader cooling phase across the crypto market.
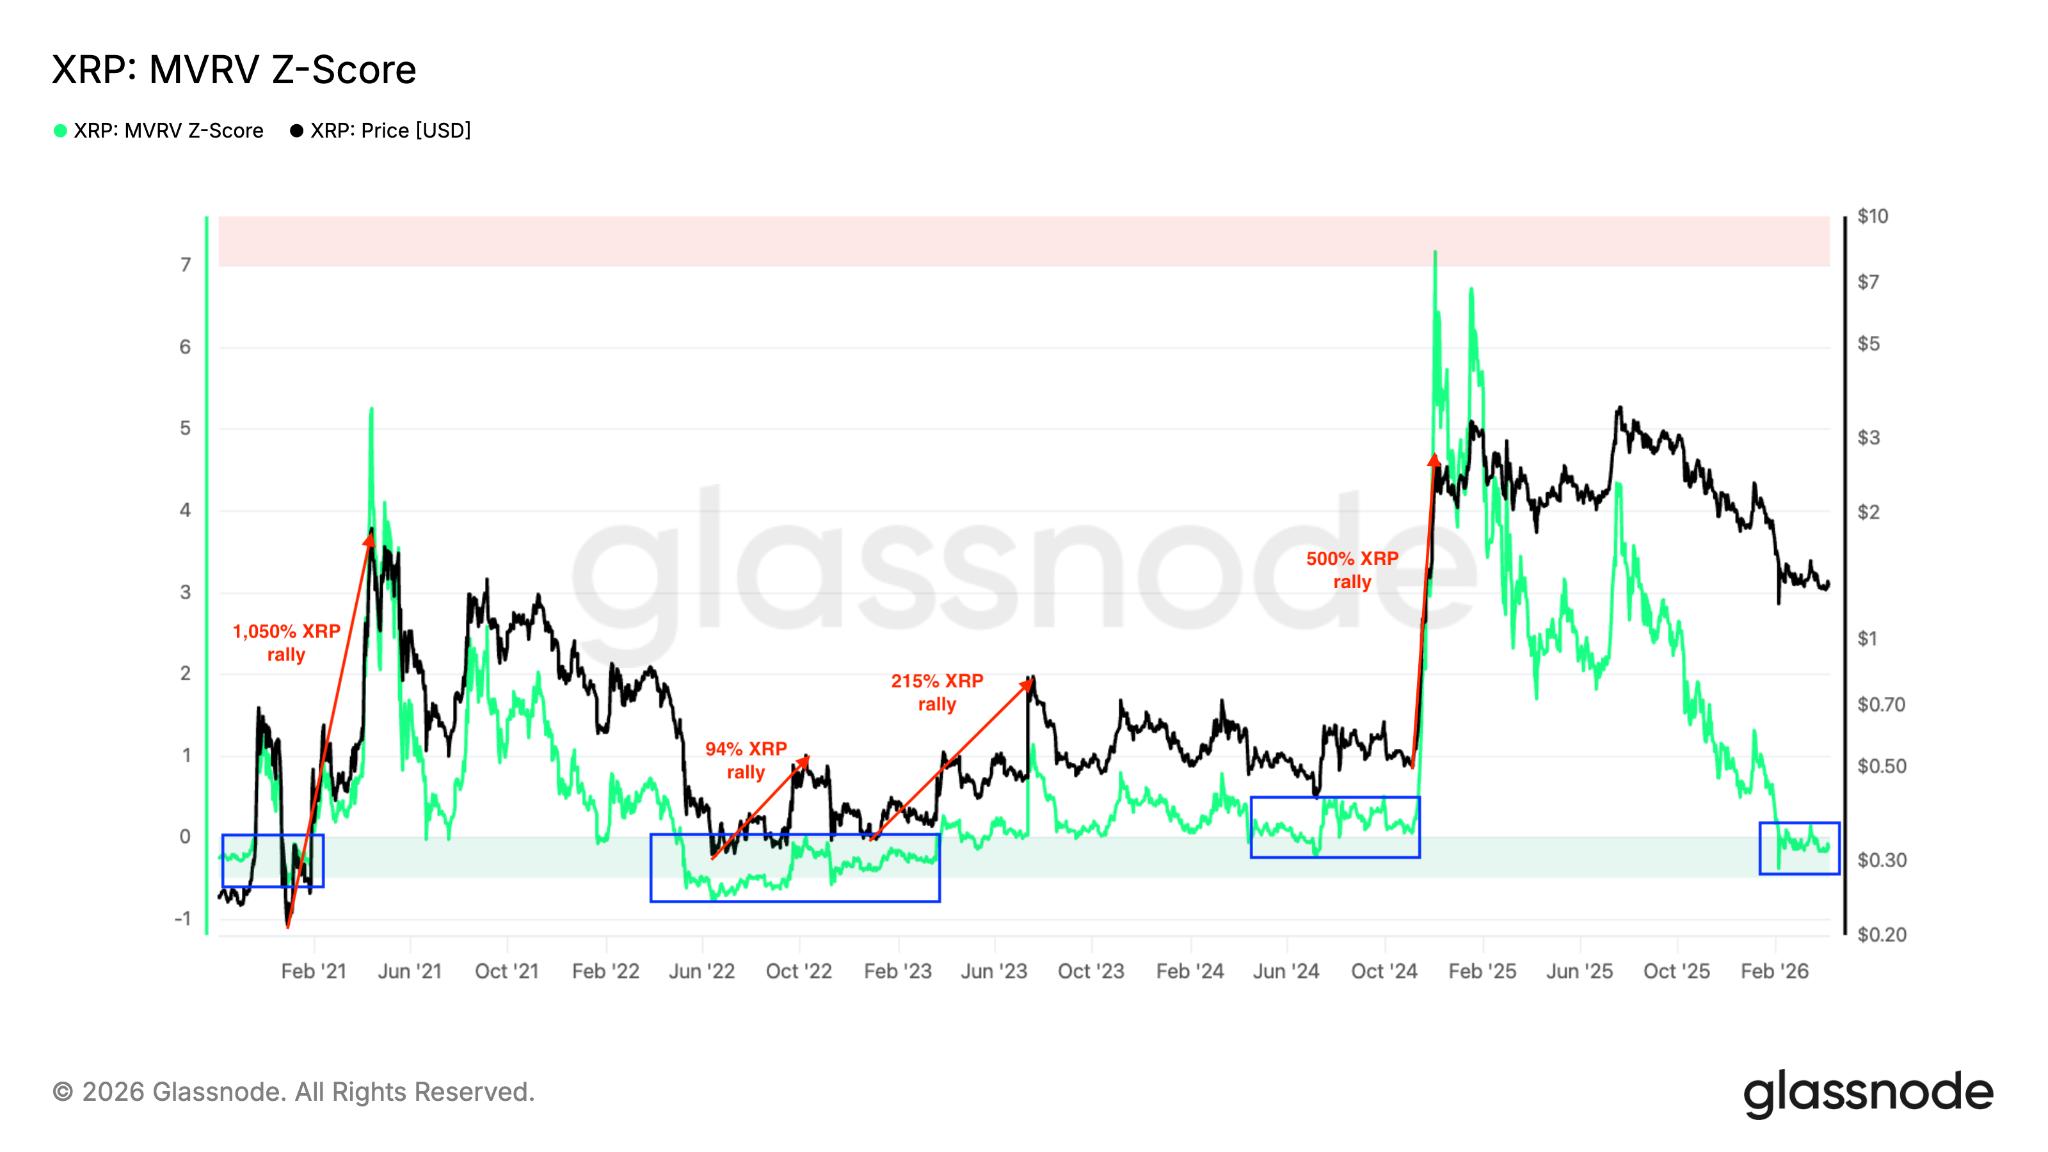 XRP MVRV Z-score vs. price | Source: Glassnode
Historical data showed similar MVRV conditions preceded strong rallies across multiple cycles. In previous cases, the XRP price recovered after extended periods of undervaluation.
During that time, downside pressure weakened. That pattern reflected a shift from distribution to accumulation among market participants.
Pricing band analysis placed a key valuation floor near recent lows, reinforcing the idea of a bottoming structure.
The alignment between price action and on-chain data suggested that downside risk had started to fade. Market behavior in earlier cycles showed that such conditions often preceded upward momentum.
XRP Price Holds Key Support Amid Weak Market Structure
Glassnode heatmap data showed a large concentration of XRP tokens accumulated around the current support region.
This cluster acted as a strong defense zone, as holders at that level showed limited willingness to sell. The move followed sustained pressure across altcoins, which dragged prices lower.
 XRP/USD cost-basis distribution heatmap | Source: Glassnode
Trader ChiefraT stated in a recent post that XRP sustained its major support zone since early Feb. 2026.
He added that holding this region could open the door for a short-term bounce toward higher resistance levels. This reaction mirrored prior cases where strong support zones triggered relief rallies.
Below that level, technical structure pointed to a deeper downside risk tied to a long-term moving average.
A break below that threshold would shift market structure into a bearish continuation phase. The current consolidation indicated a balance between buyers defending support and sellers testing weakness.
XRP price remains dependent on holding its current support zone to maintain recovery potential. If buyers sustain control, the next resistance area becomes the immediate upside target. A breakdown below support would expose the asset to further downside pressure in the short term.
The post XRP Price at Bottom Signal: Will History Trigger a Breakout? appeared first on The Market Periodical.


추천 콘텐츠

XRP Signals Imminent Breakout — Is A 10% Rally Coming?

Trump urges journalist to leave Pakistan as Iran peace talks stall


