

Ethereum Price Prediction: Can ETH Break Its Downtrend and Target $2.2K?
Ethereum has extended its recovery over the past several sessions, breaking above its recent consolidation range and approaching a major confluence resistance area. The rally has improved short-term sentiment, but the market is now testing a zone that could determine whether this move develops into a broader trend reversal or remains a relief rally within the prevailing downtrend.
Ethereum Price Analysis: The Daily Chart
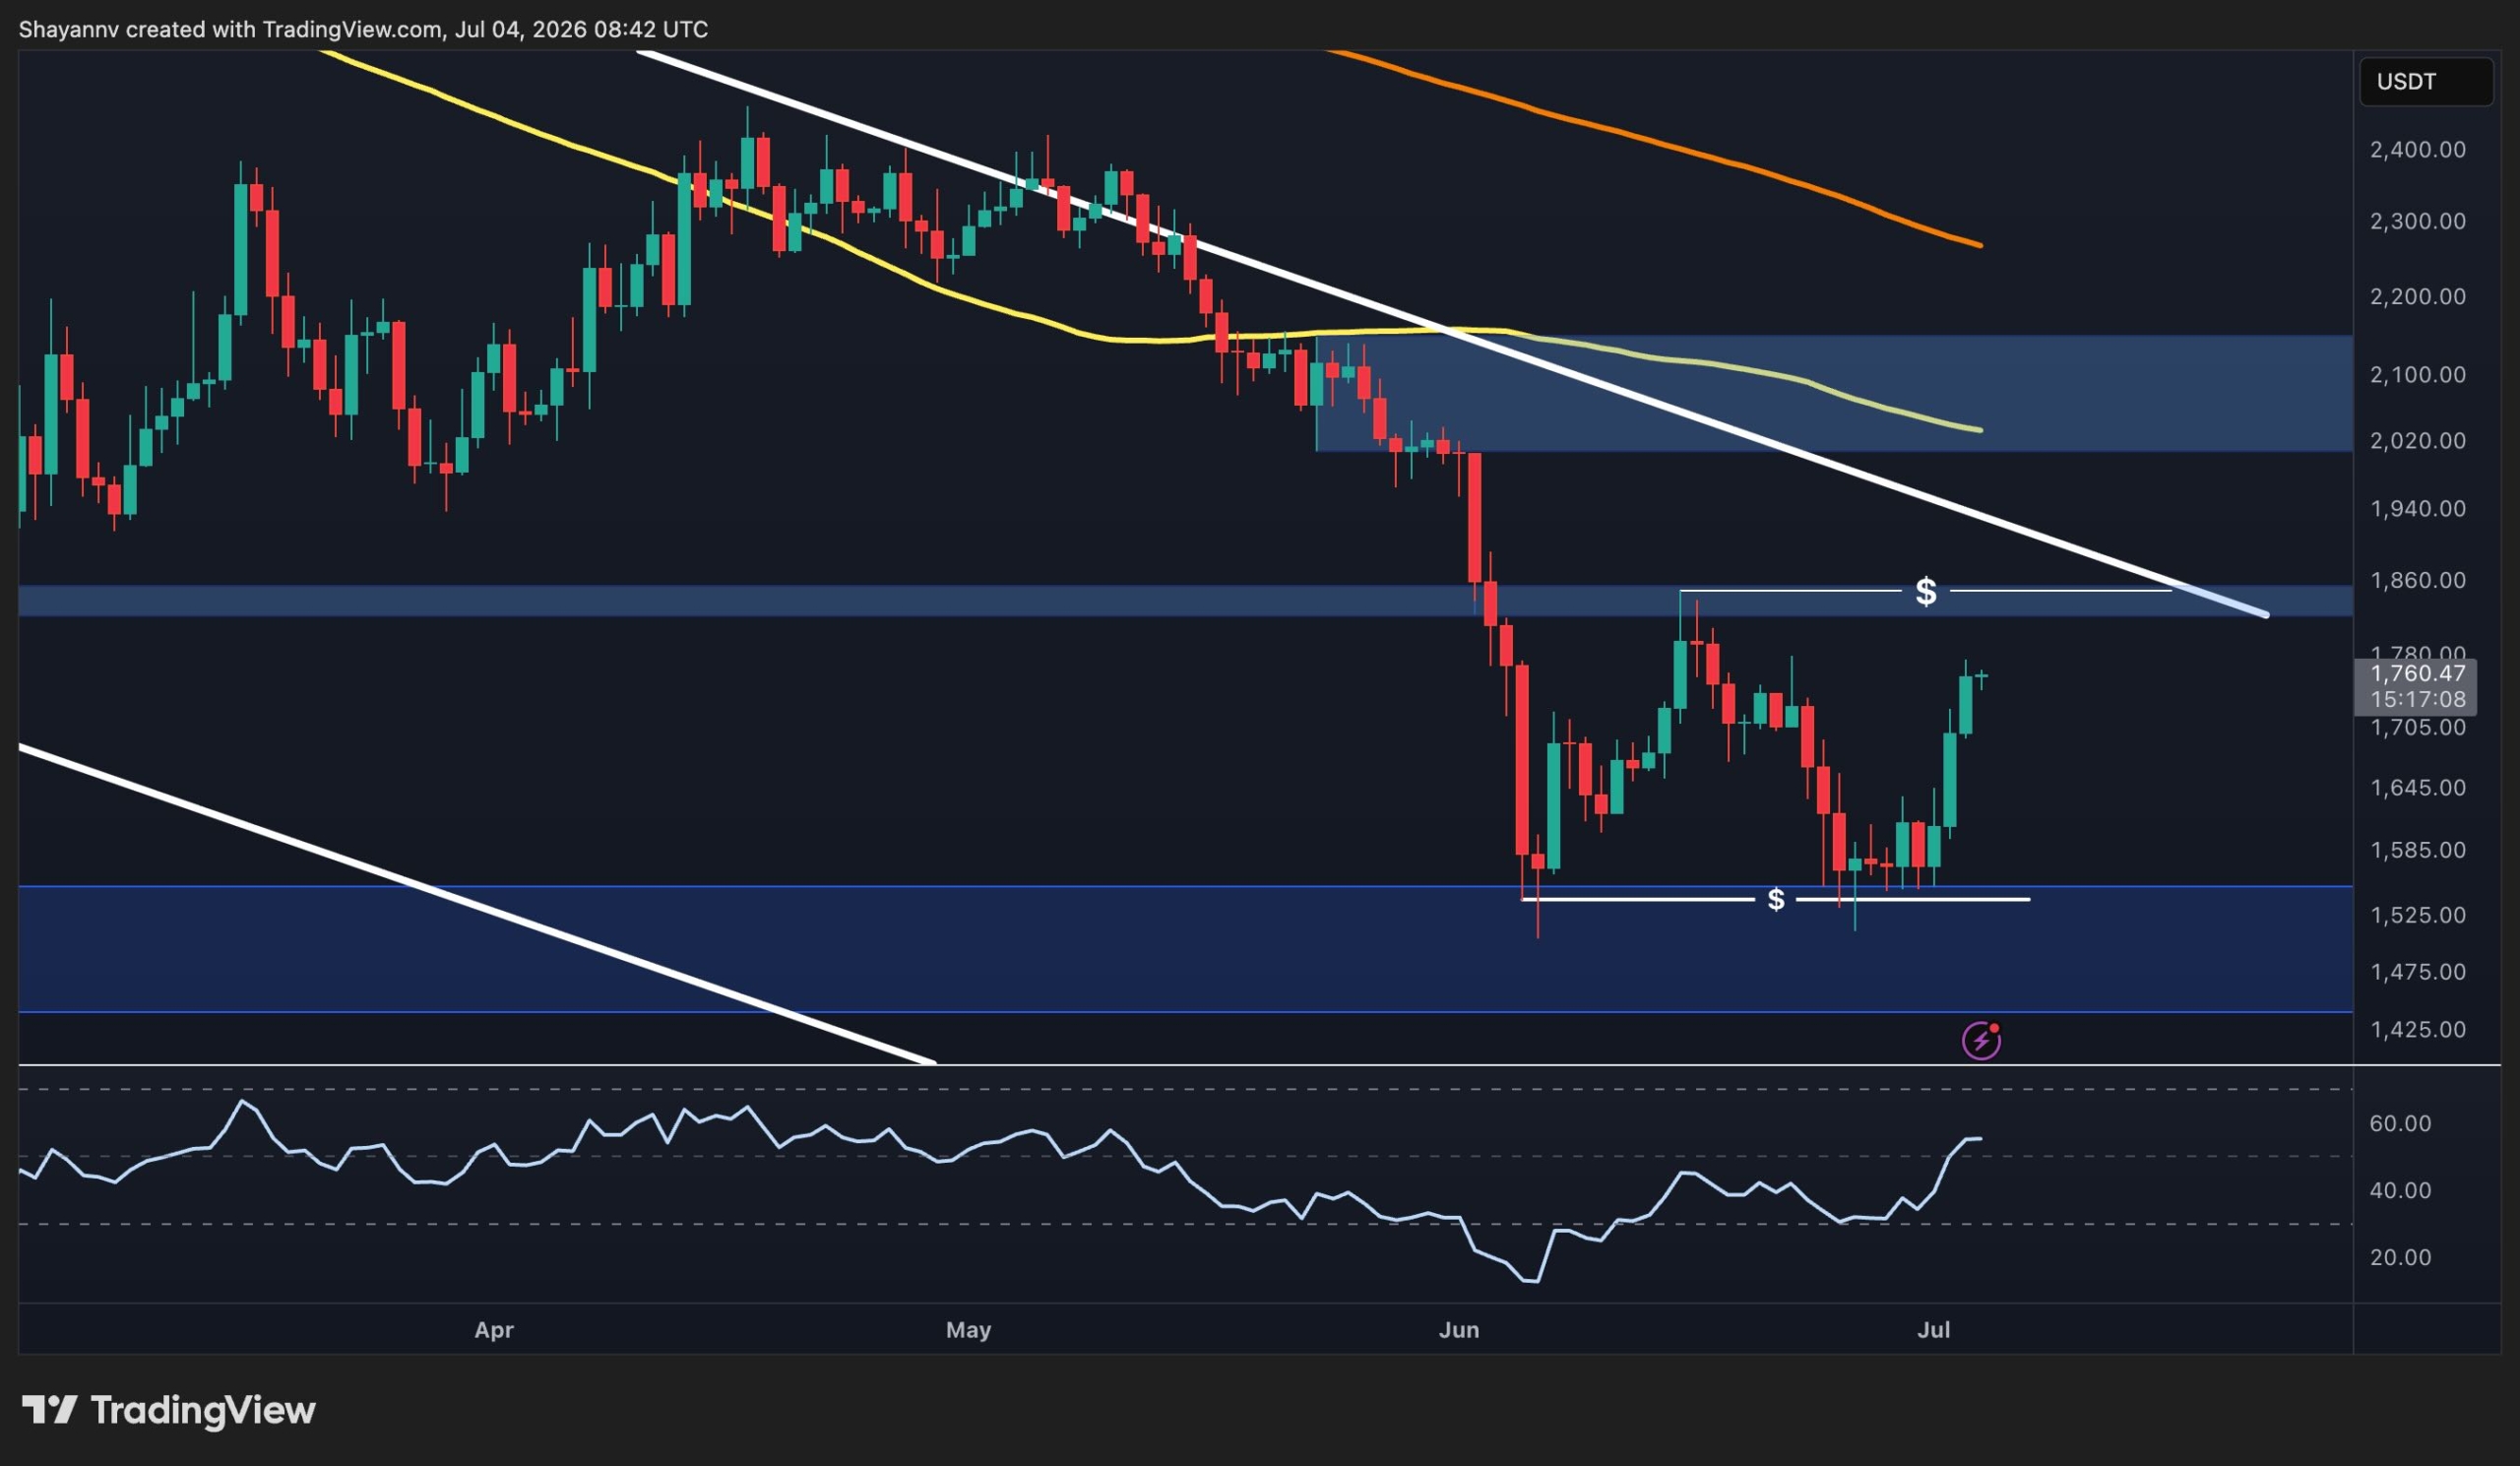
Ethereum continues to recover from the $1.46K-$1.53K demand zone, where buyers once again stepped in after defending the June lows. The rebound has now carried price toward the descending trendline that has capped every major rally since the May peak.
The recent advance has also reclaimed the $1.70K area, placing ETH just below the next key resistance cluster around $1.82K-$1.86K. This region is particularly important because it aligns with the long-term descending trendline, creating a significant technical confluence.
Momentum has improved considerably. The previously discussed bullish RSI divergence has continued to play out, with the indicator making higher highs while price has recovered sharply from support. This suggests bearish momentum has weakened substantially compared to previous sell-offs.
Nevertheless, the broader trend cannot be considered bullish until Ethereum breaks above the descending trendline and reclaims the higher resistance band. A rejection from this area would preserve the sequence of lower highs that has defined the market for the past several months.
 Source: TradingView
ETH/USDT 4-Hour Chart
The 4-hour chart shows that Ethereum has successfully broken above its short-term consolidation and reached the first resistance zone around $1.70K-$1.74K. Buyers have maintained strong momentum following the breakout from the lower range, allowing the price to approach the upper boundary of the descending structure.
Price is now trading just beneath the falling trendline that has repeatedly rejected previous recovery attempts. A decisive breakout above this trendline would represent the first meaningful structural improvement since the broader decline began and could open the door for a move toward the $1.82K-$1.86K resistance area.
As long as Ethereum remains above the recently reclaimed $1.70K region, buyers retain short-term control. However, failure to overcome the descending trendline could trigger another rejection, sending price back toward lower support levels and extending the broader corrective structure.
 Source: TradingView
Sentiment Analysis
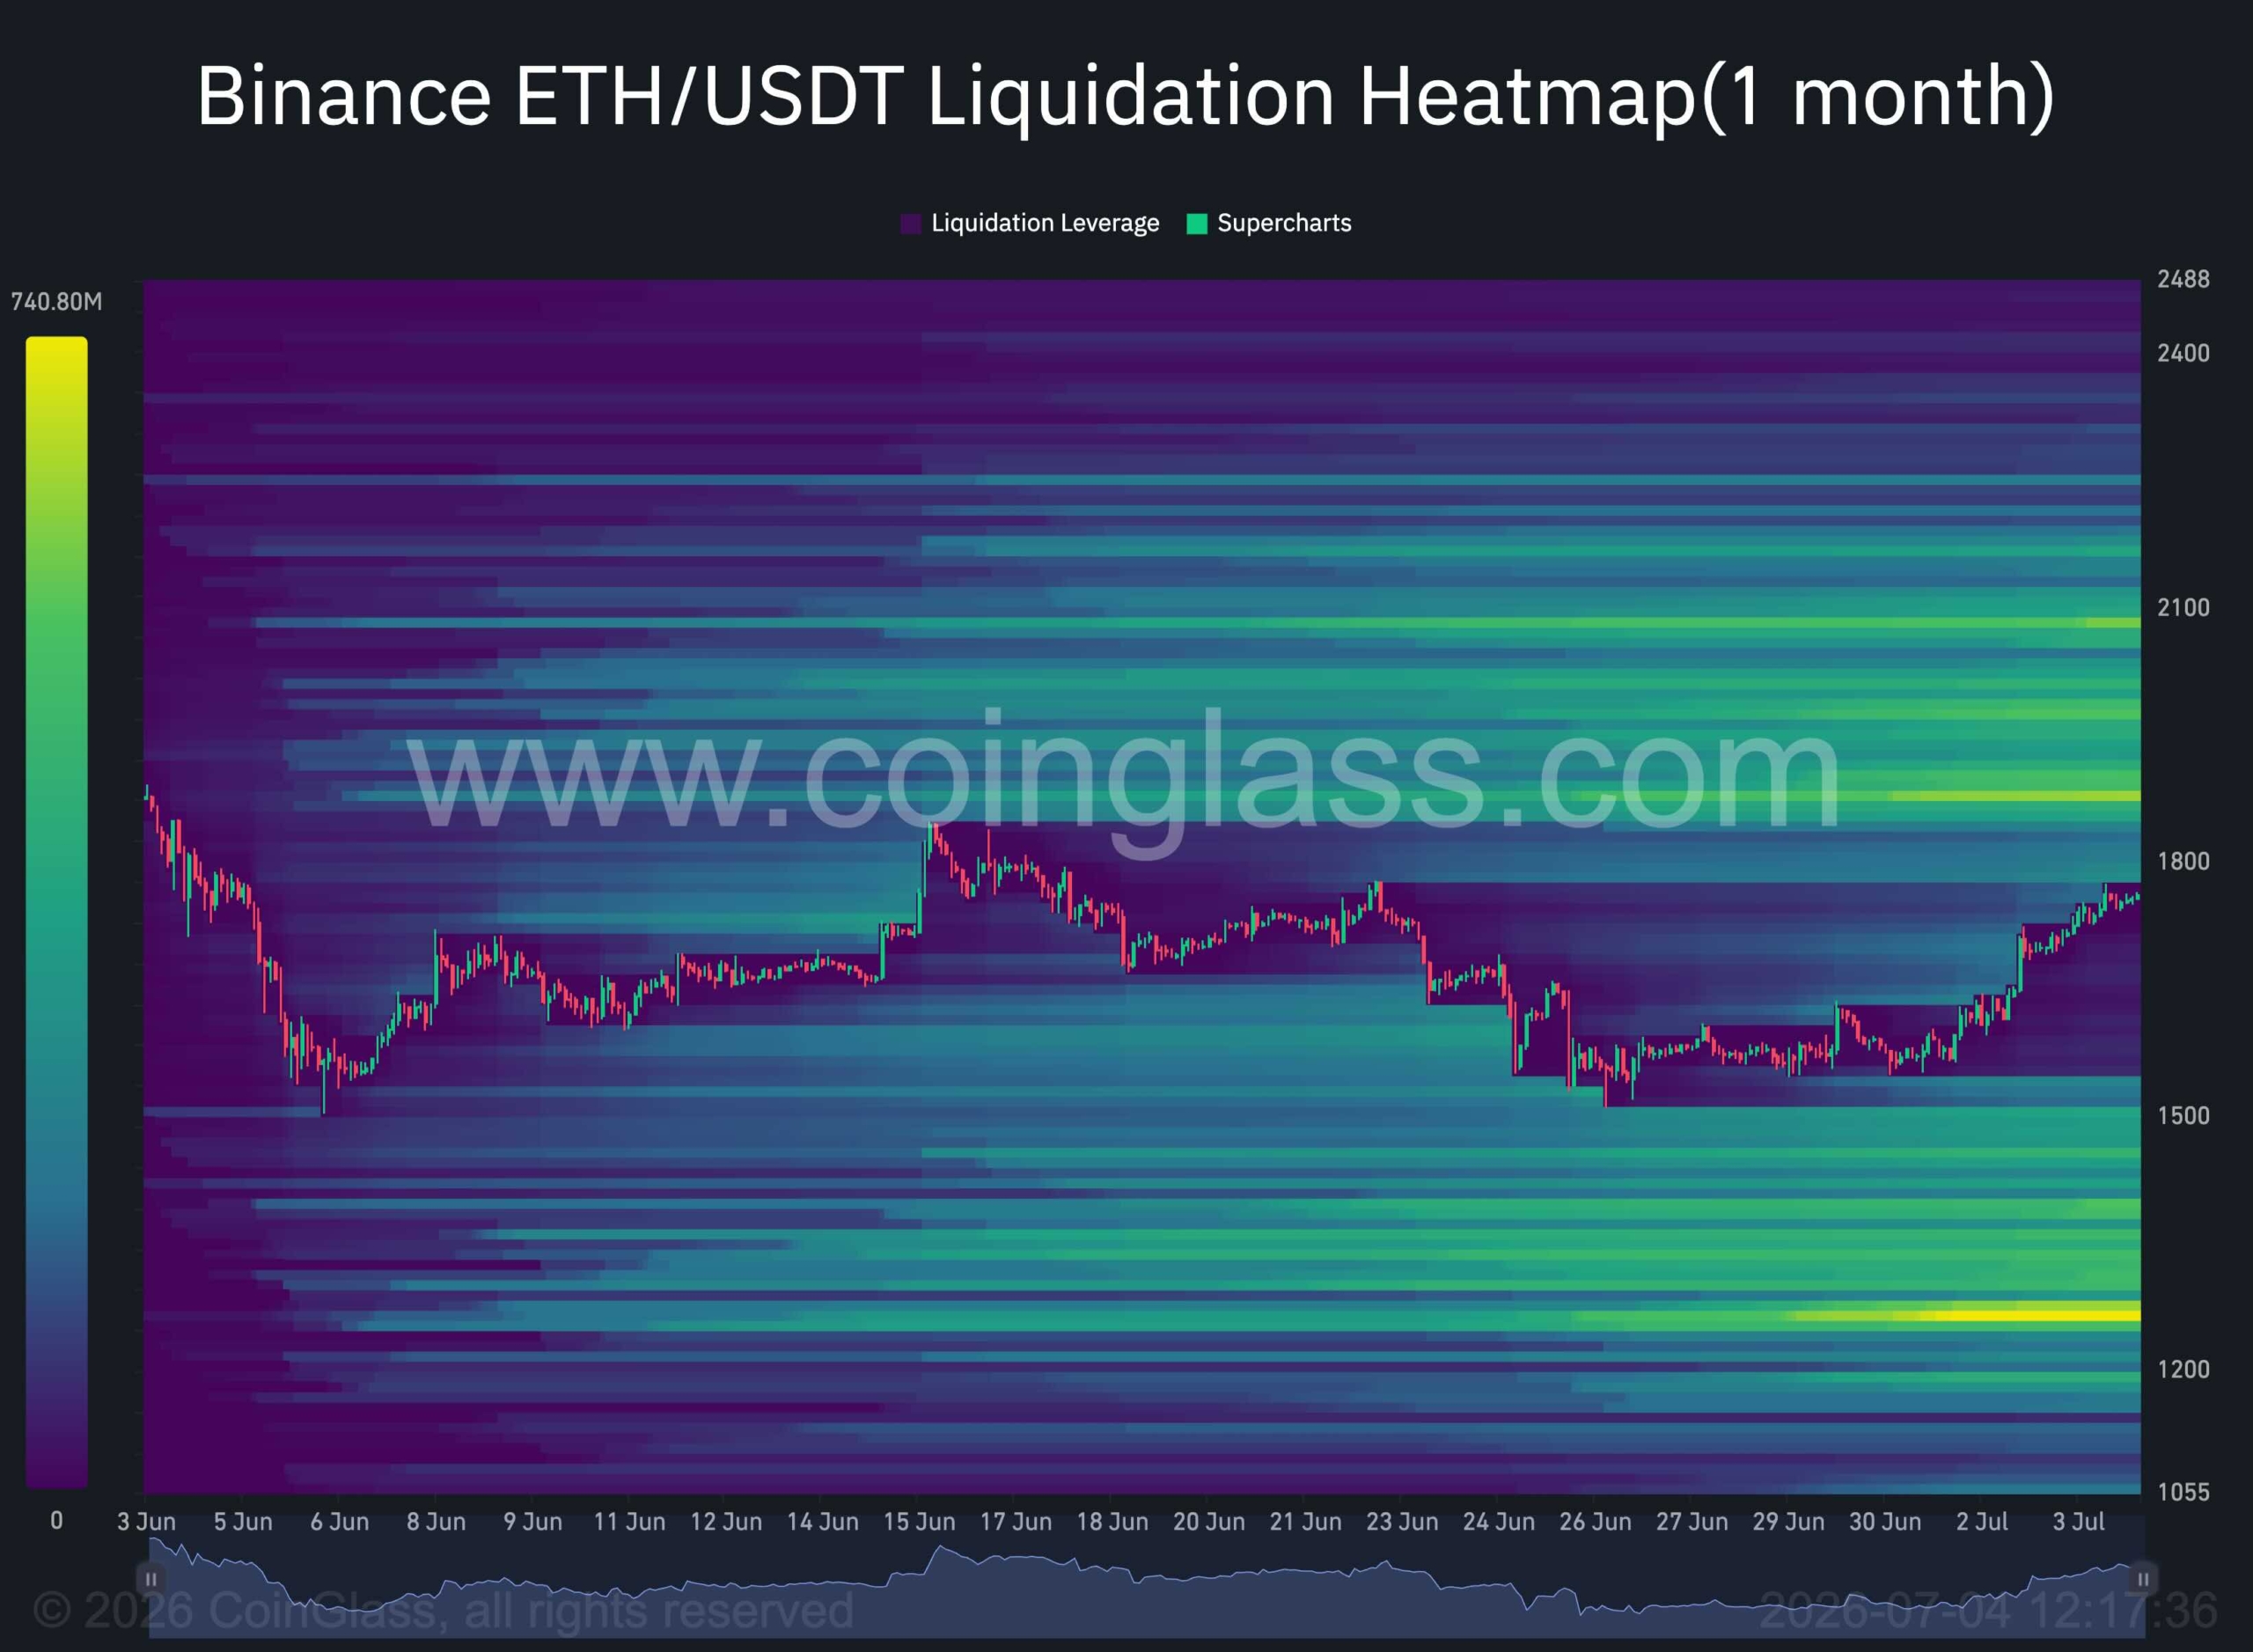
The one-month liquidation heatmap highlights a significant concentration of leveraged positions above the current market price, particularly within the $2K-$2.2K region.
These overhead liquidity clusters could act as a magnet for price in the coming sessions. If Ethereum successfully clears the descending trendline and continues its recovery, the market may accelerate toward this area as short liquidations fuel additional upside momentum.
However, the reaction after such a liquidity sweep may prove even more important than the rally itself. Once the $2K-$2.2K liquidity has been absorbed, the market will likely reveal whether buyers have accumulated enough strength to establish a sustainable bullish trend or whether the move was primarily a liquidity-driven squeeze.
If bullish momentum remains strong after clearing the overhead liquidity, Ethereum could enter a broader recovery phase. Conversely, failure to hold above that region would increase the probability of another significant decline, with price potentially rotating lower to target the sizeable liquidity clusters that remain beneath the current market. Such a sequence would fit the market’s tendency to move between major pools of leveraged liquidity before establishing its next directional trend.
 Source: Coinglass
The post Ethereum Price Prediction: Can ETH Break Its Downtrend and Target $2.2K? appeared first on CryptoPotato.


Potrebbe anche piacerti

Inside Taylor Swift and Travis Kelce’s lavish New York wedding with A-list guests

Marcos: Flood control corruption probe far from done

Vitalik Buterin Outlines Priorities for ‘Lean Ethereum’ Roadmap


Notizie di tendenza
Altro
