

Verizon Stock Faces Forced Selling After Dow Exit — $44.49 in Sight

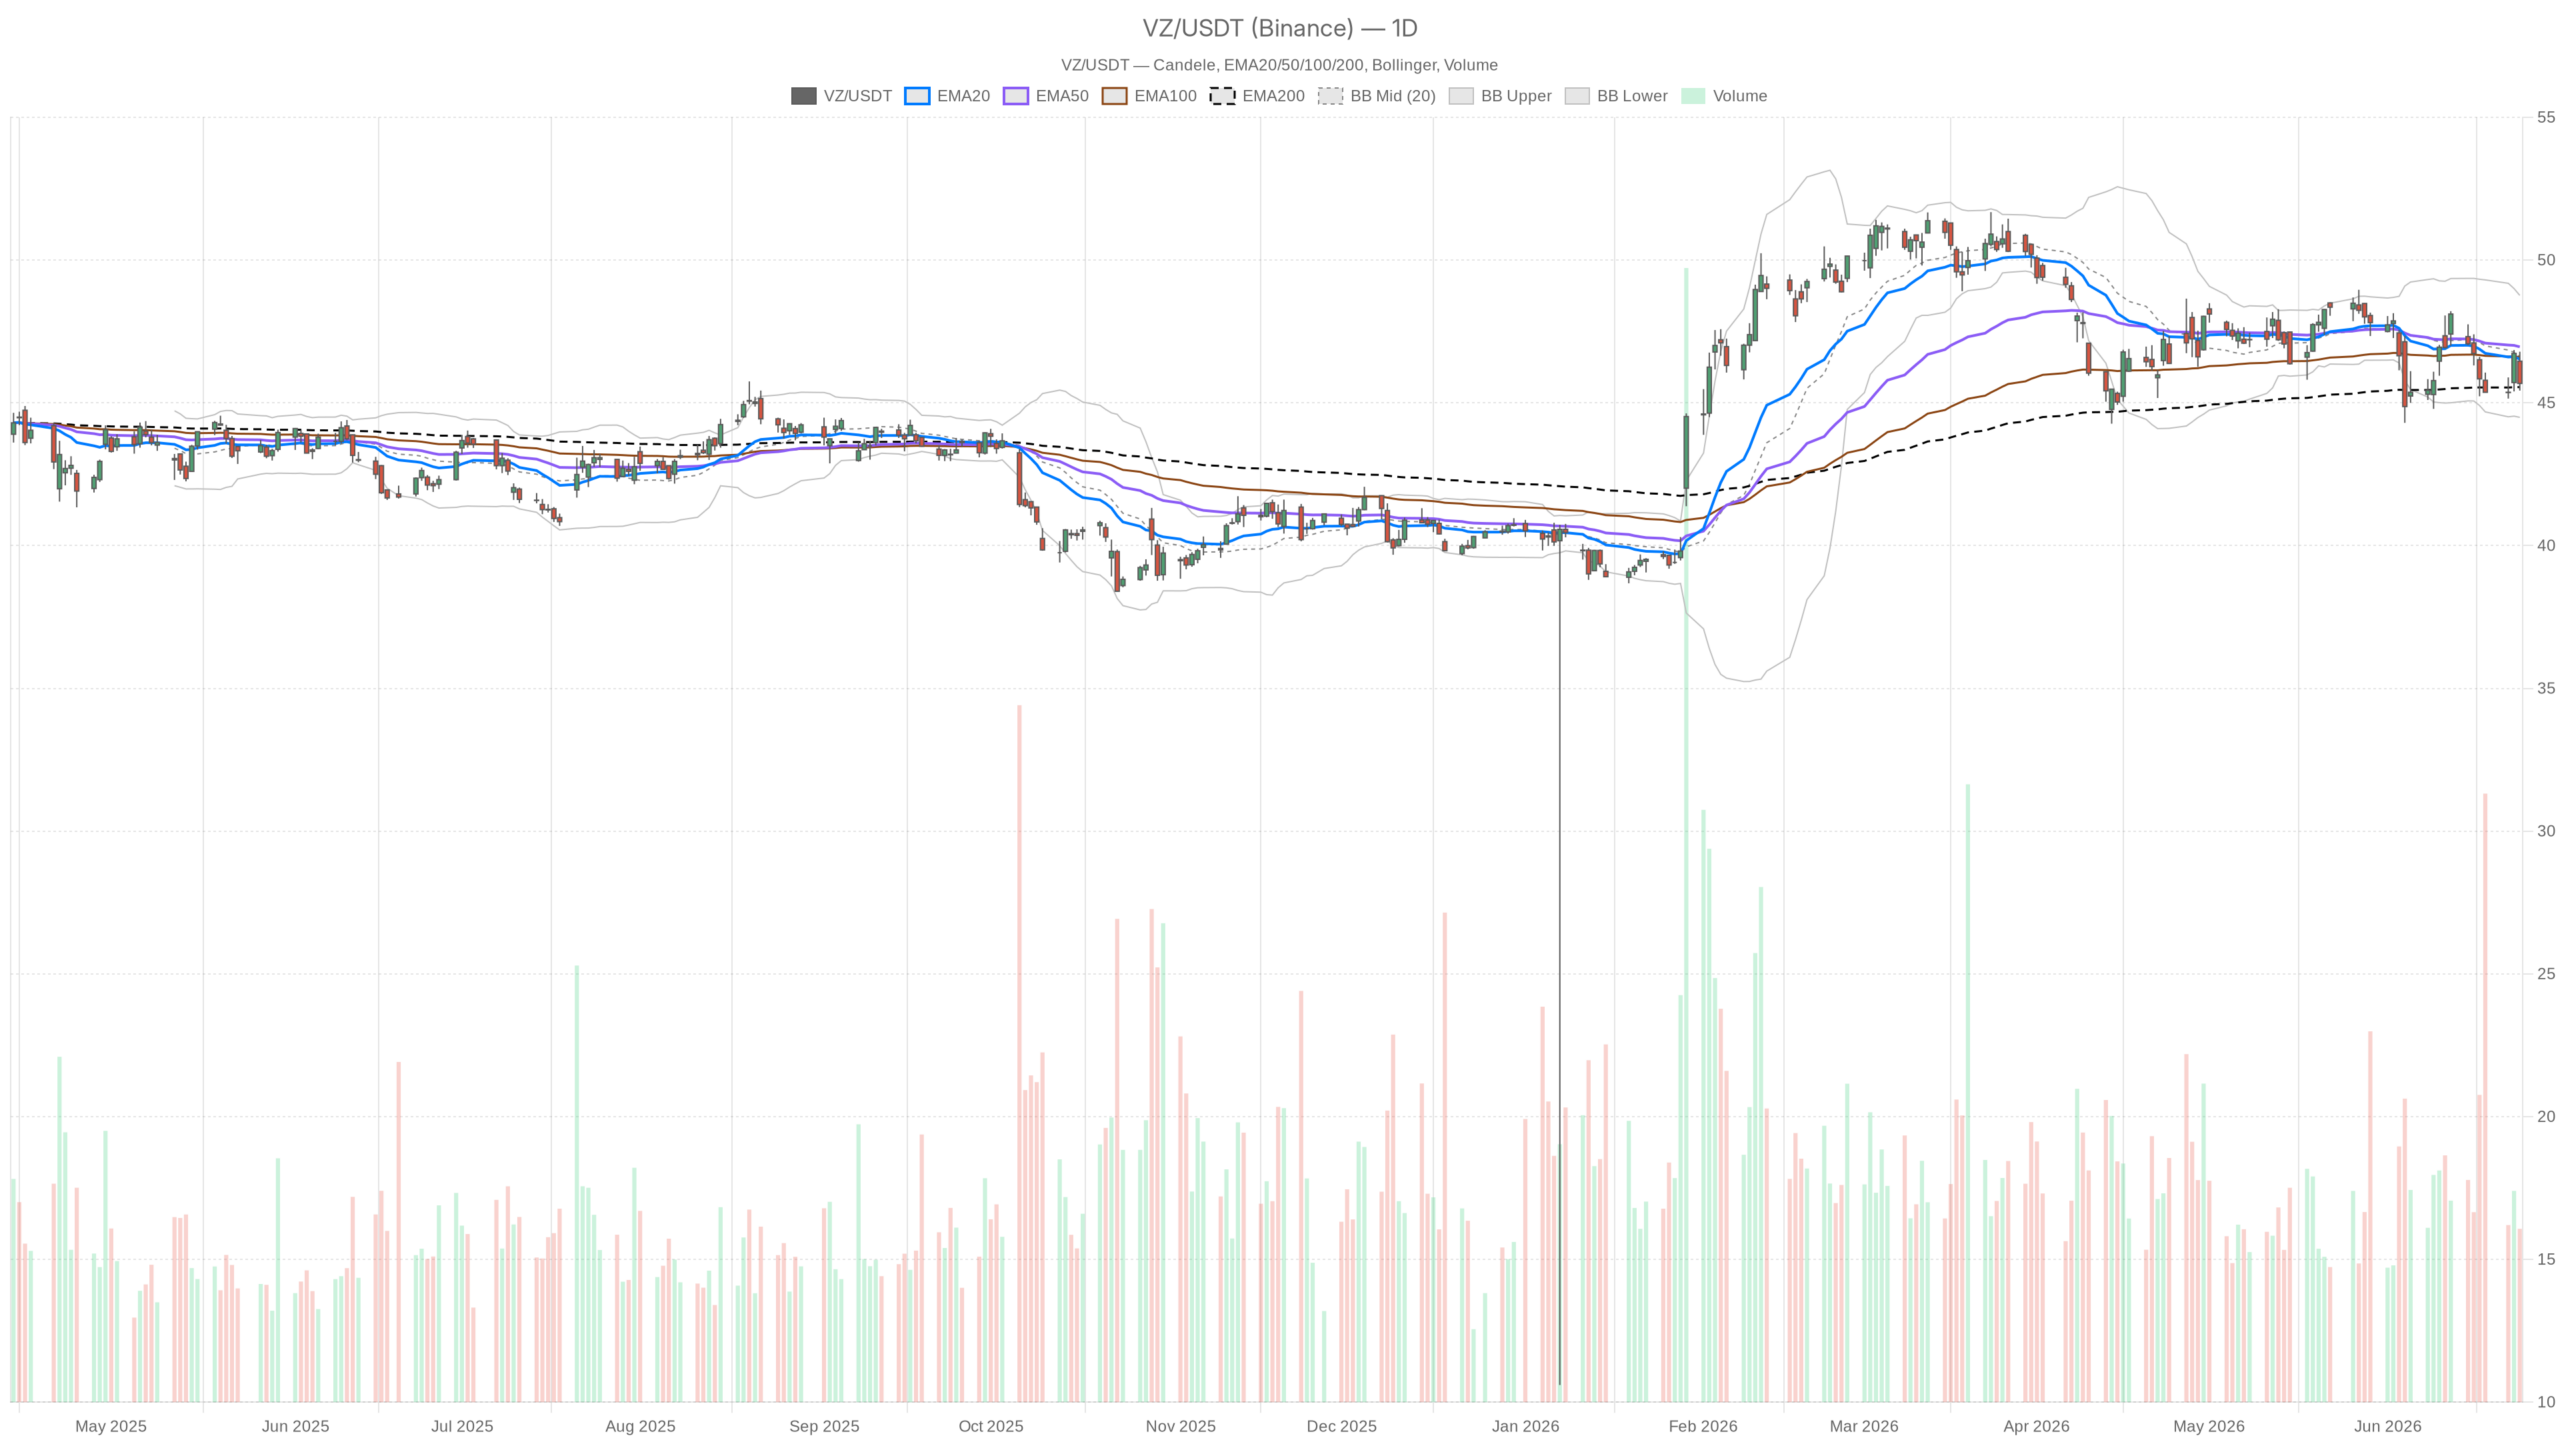 VZ — daily chart with candlesticks, EMA20/EMA50 and volume.
Key takeaways
- Verizon stock trades at $45.68, below its 20-day EMA ($46.53) and 50-day EMA ($46.96).
- The Dow Jones Industrial Average removal triggers forced selling from index-tracking funds in the near term.
- The daily EMA200 at $45.55 provides thin support — a decisive break below it would be technically significant.
- The bearish case remains better supported; a daily close below S1 support at $45.14 opens the path toward $44.49.
- Recovery above the daily pivot at $45.97 is required to stabilize the near-term technical outlook.
What Is the Daily Chart Telling Us About Verizon Stock’s Trend?
The daily chart points to a bearish tilt for Verizon stock. Price is trapped below the 20-day and 50-day EMAs. Momentum indicators confirm the weakness without showing acceleration. The stock is drifting lower, not collapsing — at least not yet.
Price closed beneath the EMA20 at $46.53 and the EMA50 at $46.96. Both now act as near-term resistance. The one stabilizing element is the EMA200 at $45.55, sitting just below current price. However, this level offers thin support rather than a strong structural floor. A sustained break below it would carry real technical significance.
Meanwhile, daily momentum confirms the soft tone. The RSI14 reads 43.75 — below the neutral 50 mark but not deeply oversold. The MACD line sits at -0.38 against a signal of -0.31. The resulting negative histogram is only marginally wider at -0.07. This suggests downward pressure is present but not accelerating sharply.
Bollinger Bands frame the situation clearly. The midline at $46.63 sits above price. The stock trades in the lower half of the band. The lower Bollinger Band at $44.49 marks the wider downside risk if selling intensifies. At the same time, the daily ATR of 1.28 reflects moderate volatility — enough room for intraday swings without signaling a panicked environment.
What Are the Key Technical Levels for Verizon Stock?
The critical levels for Verizon stock are the daily pivot at $45.97, S1 support at $45.14, and the EMA200 at $45.55. These three markers will define the near-term directional bias. Price closed at $45.68 — below the pivot and drifting toward the S1 zone.
A daily close below $45.14 would confirm fresh short-term weakness. That breakdown would open the door toward the lower Bollinger Band at $44.49. Conversely, reclaiming the daily pivot at $45.97 on a closing basis would at least stabilize the picture. The next upside hurdle is R1 at $46.50, which aligns roughly with the EMA20. Clearing both levels is the minimum requirement for any credible trend shift.
For now, the stock is wedged between thin support from the EMA200 and a cluster of overhead resistance. The EMA20, EMA50, and pivot point all sit above price. This compression will eventually resolve — and the direction of the break matters greatly.
How Does the Hourly Picture Reinforce the Bearish Case?
The hourly chart reinforces the bearish outlook in textbook fashion. All three EMAs are stacked above price in descending order. The EMA20 sits at $45.92, the EMA50 at $46.12, and the EMA200 at $46.73. Price trades below all of them. That alignment leaves no ambiguity about the short-term trend.
The 1H RSI at 45.2 echoes the daily reading. Upside momentum is simply absent. The MACD on this timeframe is mildly negative. Still, it aligns with a slow, grinding drift lower rather than aggressive selling. The message is consistent across timeframes. There is no divergence to suggest a pending reversal.
Is There Any Sign of Short-Term Stabilization?
Only a faint technical flicker appears on the 15-minute chart — not enough to signal a reversal. The MACD histogram has turned slightly positive at +0.04, even as the MACD line itself remains negative. This minor divergence hints at potential stabilization near current levels. Yet the 15m RSI at 45.9 remains neutral-to-soft.
This is not a buy signal. It is a pause within the broader downtrend. Execution-wise, it suggests Verizon stock may consolidate in the $45.65–$45.79 range before the next directional move emerges. Traders should treat this as a temporary holding pattern, not a reason to turn constructive.
What Does the Dow Removal Mean for Verizon Stock?
The Dow removal creates near-term forced selling from index funds, though the long-term picture may be more nuanced. VZ’s exit from the Dow Jones Industrial Average means index funds tracking the DJIA become forced sellers of the stock. That mechanical pressure can weigh on price in the days surrounding the effective change.
However, some historical precedent actually favors Dow deletions over the long run. CNBC noted that removed stocks have tended to outperform their replacements over time. This counterargument is credible. Yet it operates on a much longer horizon than the immediate technical pressure Verizon stock now faces. Short-term traders should stay focused on price action, not long-term precedent.
What Fundamental Factors Support Verizon Stock?
Verizon’s deleveraging efforts and defensive yield appeal provide structural support, even if they lack near-term catalytic power. The company completed roughly $1.86 billion in debt tender and exchange offers during June 2026. That move, combined with simplified plan structures under the Simplicity and Verizon One brands, reflects management’s push to streamline the business.
These are constructive signals for longer-term holders. Yet they offer little immediate price catalyst. Separately, Tuesday’s session saw VZ gain nearly 3% alongside other dividend-paying defensives. That rally came as AI chip momentum stalled and investors rotated into yield. It underscores VZ’s continued appeal as a defensive, income-generating name. However, the very next session saw that strength partially fade — a revealing sign of the stock’s current lack of conviction.
What Is the Bullish Case for Verizon Stock?
The bullish scenario requires a firm hold above the EMA200 followed by a reclaim of the daily pivot at $45.97. Without these two steps, any upside attempt lacks credibility. The first requirement is a clean daily close above $45.55. The second is a recovery through $45.97 and then toward R1 at $46.50.
The dividend-driven defensive bid — visible in Tuesday’s rally — could resurface quickly if broader equity sentiment softens again. In that scenario, Verizon stock could grind back toward the $46.50–$47.00 range. This outcome is possible but not yet supported by the current chart evidence. Patience is required until the technical setup improves.
Why Is the Bearish Case Better Supported Right Now?
The bearish case is stronger because the stock trades below three key daily EMAs. Both the daily and hourly timeframes align negatively. Meanwhile, the Dow deletion adds mechanical selling pressure from passive fund rebalancing. The weight of evidence tilts toward further downside until proven otherwise.
A daily close below $45.14 — the S1 support — would open the door toward the lower Bollinger Band at $44.49. That represents a further decline of roughly 2.6% from current levels. Such a move would meaningfully shift the technical landscape. It would confirm that sellers remain in full control and that the EMA200 floor has failed. Until the daily EMA cluster is convincingly reclaimed, the bearish case deserves more weight.
FAQ
Why is Verizon being removed from the Dow Jones Industrial Average?
Alphabet (Google) is replacing VZ in the DJIA. Index funds tracking the Dow will be forced sellers of Verizon stock, creating near-term selling pressure. The effective date of the change will be the focal point for that mechanical flow.
What is the most important support level for Verizon stock?
The daily EMA200 at $45.55 serves as immediate support. Below that, the S1 pivot support at $45.14 is the next critical floor. A break under S1 would expose the lower Bollinger Band at $44.49 as the subsequent downside target.
Is Verizon stock a buy right now?
The technical setup remains soft-to-bearish. The daily bias is negative and confirmed by the hourly chart. A sustained recovery above the daily pivot at $45.97 and then R1 at $46.50 would be needed to shift the outlook. Current evidence does not support an aggressive entry.
Does the Dow removal make Verizon a worse long-term investment?
Not necessarily. Historical precedent shows Dow-deleted stocks have tended to outperform their replacements over the long run. Verizon’s deleveraging efforts and defensive yield characteristics remain intact. However, near-term price action will be dominated by technical and flow-driven factors.
Disclaimer: This article is for informational purposes only and does not constitute financial advice, an investment recommendation, or a solicitation to buy or sell any financial instrument or cryptocurrency. The analysis provided is not indicative of future results. Investing in crypto assets and financial markets carries a high risk of capital loss. Always do your own research (DYOR) and consult a qualified financial advisor before making any decision.
Article produced with the assistance of artificial intelligence and reviewed by the editorial team.


Potrebbe anche piacerti

Apple Price Shock: Macs And iPads Jump $200 Or More As Memory Crisis Worsens
Digital Currency X Technology Enters Into Securities Purchase Agreement for a Private Placement of US$700 Million of Units, Payable in U.S. Dollars or Digital Assets, to Advance Its Digital Asset Treasury Strategy

Jeers rain down on Sean Duffy over Great American Fair remarks: 'You're garbage'


Notizie di tendenza
Altro
