Bitcoin’s Last $80k Support in Jeopardy: Will Altcoins Follow?

Bitcoin’s break below the $84,000 threshold shifts momentum in favor of bears, opening the door to a potential test of the $74,508 level if selling accelerates. In the meantime, sentiment is turning more cautious as several top altcoins slip below crucial support zones, suggesting a broader consolidation or renewed downside pressure. The move comes as traders weigh macro catalysts and previous tariff-related rhetoric that has flavored price action in the early part of the year. On a technical front, a number of assets flirt with key moving averages, with bulls needing to defend critical lines to avert further declines.
Key takeaways
- Bitcoin breached the $84,000 level and could extend the downside toward $74,508 if bears maintain control and crucial support around $80,600 gives way.
- Several leading altcoins fell below important support thresholds, signaling that selling pressure is broadening beyond BTC.
- In the latest 24 hours, Bitcoin liquidations surged, reaching approximately $1.77 billion as prices slid toward $81,000.
- Some analysts see a potential bottom forming in the coming weeks, noting BTC bottoms have historically lagged gold’s relative strength by about 14 months.
- A potential relief rally hinges on bulls defending key levels and reclaiming moving averages, which could unlock a rebound toward near-term resistance zones.
Tickers mentioned: $BTC, $ETH, $BCH, $DOGE, $ADA, $SOL, $XRP, $BNB, $XMR, $HYPE
Sentiment: Bearish
Price impact: Negative. The break below $84,000 and the ensuing move toward the $80,600–$74,508 area point to renewed selling pressure across the market, with liquidity spikes underscoring the risk-off tone in the near term.
Trading idea (Not Financial Advice): Hold. Near-term risk remains, but a successful defend at key levels could set up a relief rally if momentum shifts back above major moving averages.
Market context: The price action unfolds in a backdrop of risk-off sentiment in crypto markets, with traders watching technical levels closely alongside macro cues and regulatory dynamics that have historically influenced flows and liquidity in the sector.
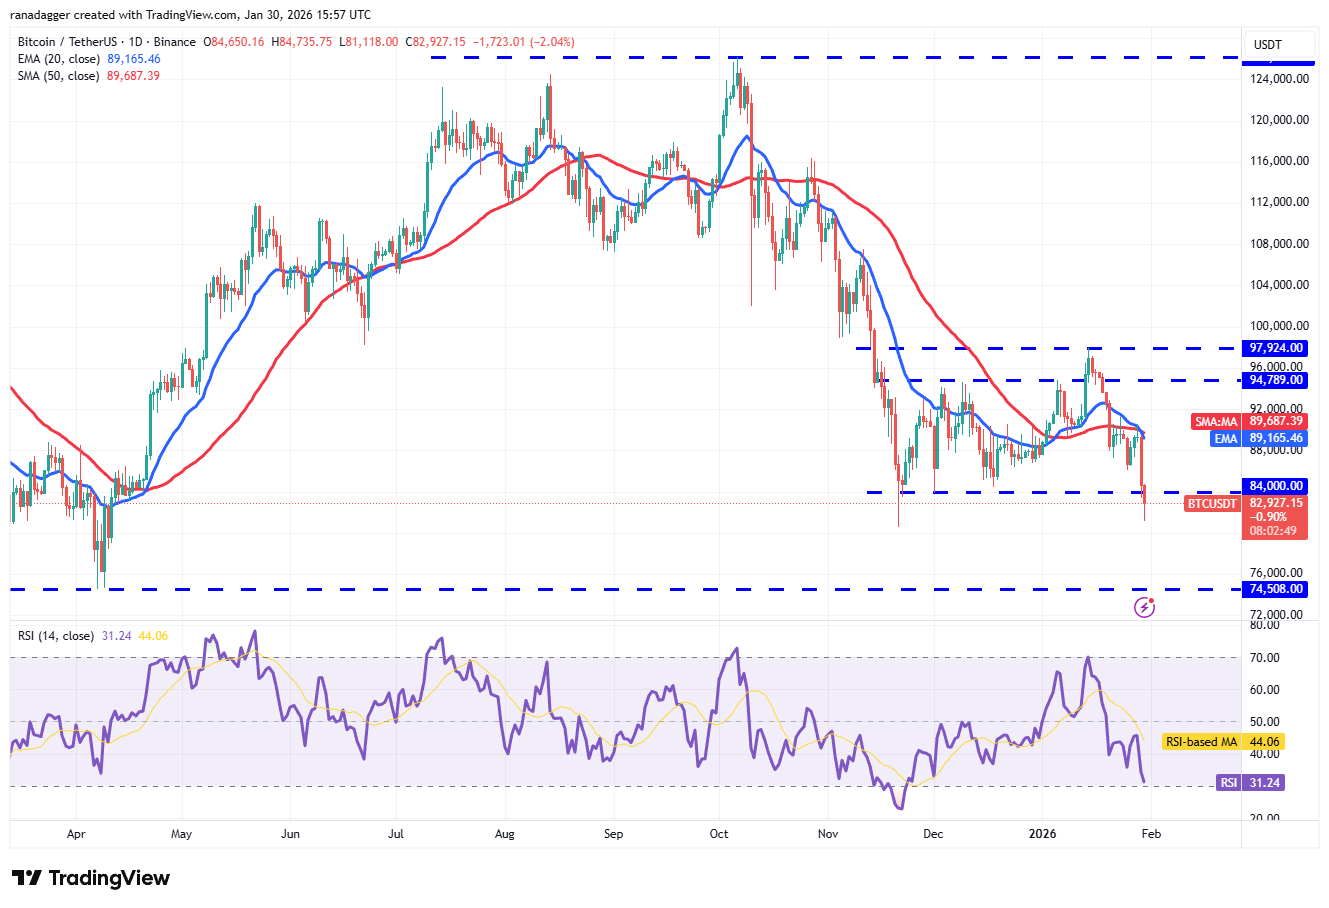
Bitcoin’s latest move came after it turned sharply lower from a rally attempt near the 20-day exponential moving average (EMA). The pullback took BTC below the $84,000 zone, a threshold that had stood as a short-term guardrail for bulls. The ensuing price action nudged the market toward an important near-term inflection: the $80,600 level. A clean break below there would open the door to the next meaningful support at $74,508, a level that previously featured as a multi-month anchor in the mid-2025 trading range. The price action at roughly $80,600 is particularly crucial because it represents a tipping point—holding could indicate a renewed effort to reclaim the moving averages, while a breach would reinforce the downside tilt.
Crypto market data daily view. Source: TradingViewOn the momentum side, a rapid bout of liquidations accompanied the dip toward the $81,000 region, with data tracking sites showing roughly $1.77 billion liquidated in the past 24 hours. That level of leverage-driven pressure can amplify moves through short-term stops and cascading liquidations, intensifying near-term volatility. The burst of selling aligns with a broader narrative among technicians who see the market testing long-established supports before deciding whether a larger reversal is in play.
Sway toward a more cautious view has gained traction among analysts who see BTC potentially testing lower levels in the near term. The consensus among some strategists is that BTC could drop below $74,500, a level cited as a critical trough in a recent analysis tied to a now-referenced macro event: a tariff announcement during a period labeled by some observers as a moment of “Liberation Day” in the political calendar. Those who hold this view point to a technical setup where any move back below the $84,000 threshold would increasingly pressure the market toward the next major support line in the low $70,000s before any meaningful recovery could take hold.
 BTC/USDT daily chart. Source: Cointelegraph/TradingView
Not all forecasts are unanimous. Swyftx lead analyst Pav Hundal offered a more constructive take: BTC could form a bottom over the next 40 days if historical patterns repeat, noting that BTC bottoms historically lag gold’s relative strength by roughly 14 months. The implication is that a bottom, if confirmed, might come with a delayed recovery dynamic rather than an immediate V-shaped rebound. While this perspective introduces an element of potential resilience, it sits alongside the more bearish note that the current price action is testing the lower end of the intra-month range and could extend toward a multi-month support confluence if selling persists.
Looking across the crypto landscape, the picture is decidedly mixed for the most-watched assets. Ether (CRYPTO: ETH) faced selling pressure after failing to sustain a bounce and slipping below a crucial support at $2,787, a breakdown that mirrors the risk-off mood seen more broadly. The path forward for ETH could hinge on whether the price can reclaim the 20-day EMA around $3,000 and turn the tide above the near-term moving averages. If bears press the case, a decline toward significant support near $2,623 could materialize, which would likely attract buyers on any retracement. A deeper break below $2,111 would be the next bearish milepost to watch, potentially accelerating the downtrend toward other lower targets.
 ETH/USDT daily chart. Source: Cointelegraph/TradingView
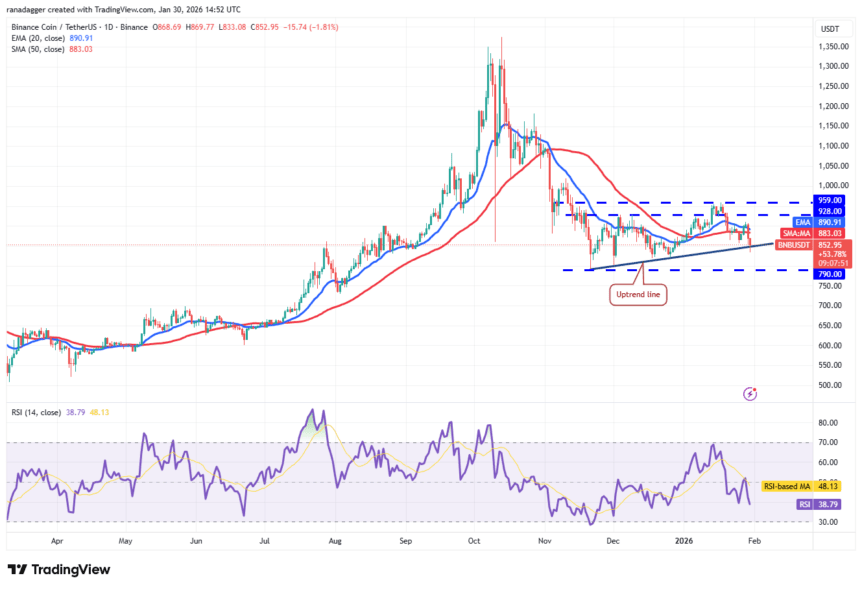
Among other major assets, the technical landscape for BNB pointed to a delicate balance. The price had dipped after failing to sustainAbove the 20-day EMA near $890, sliding toward the uptrend line that acts as a key support. A close below that line could open the door to a test of the $790 level, with a further breach risking a move toward $730. Conversely, a rebound off the uptrend line would suggest that buyers remain active on dips and could carry the token toward the $928–$959 resistance band, where the bears have historically stepped in to reassert control.
 BNB/USDT daily chart. Source: Cointelegraph/TradingView
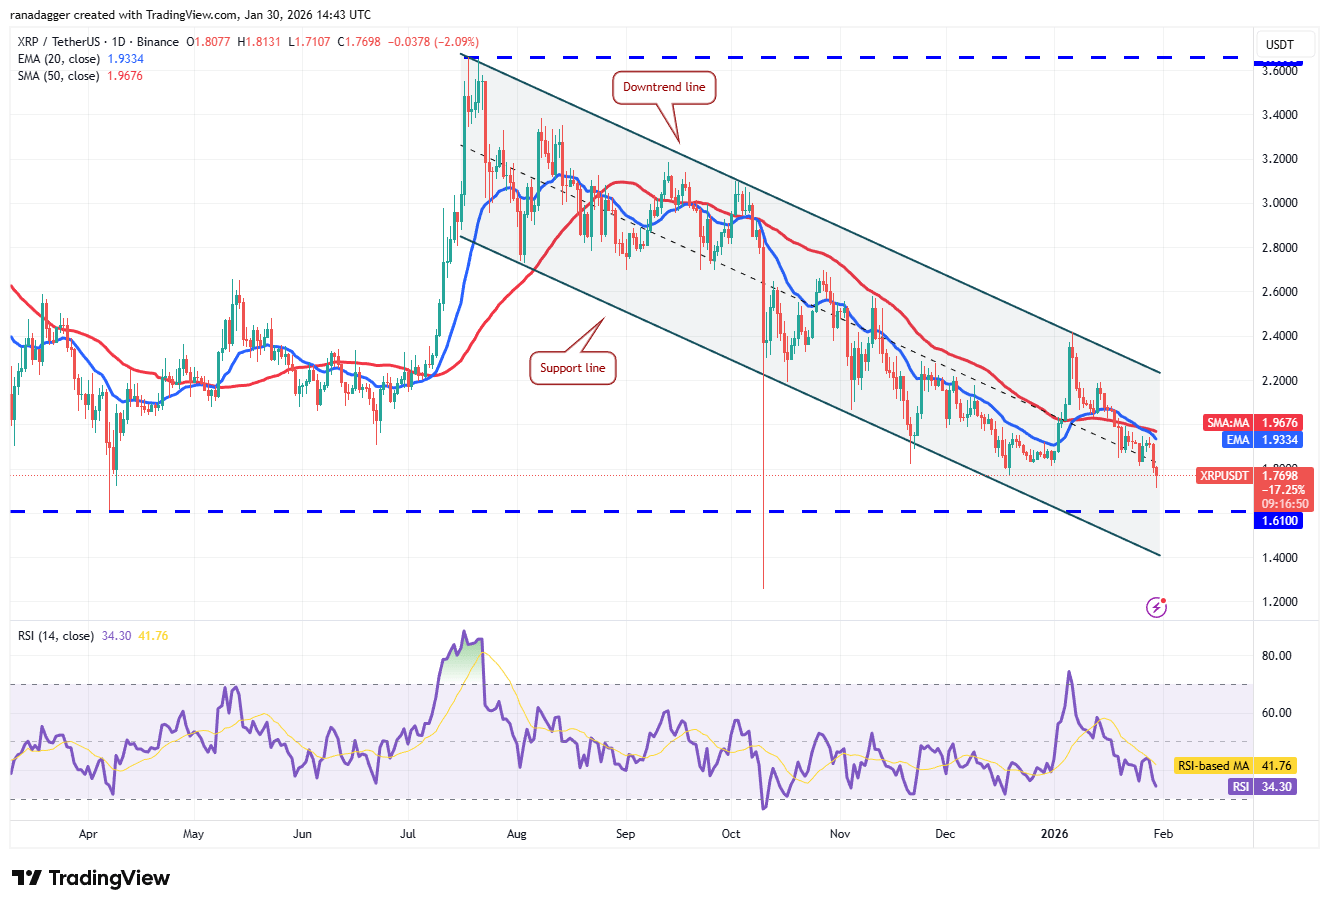
Similarly, XRP (CRYPTO: XRP) has struggled to clear the immediate overhead, slipping below the $1.77 level. The next downside target sits around $1.61, a critical zone that could determine whether the pair continues its descent toward the bounds of the current channel. A relief rally would require a move back above the moving averages and the downtrend line, which would represent a shift in the market’s tone and potentially set up a fresh test of higher resistance levels.
 XRP/USDT daily chart. Source: Cointelegraph/TradingView
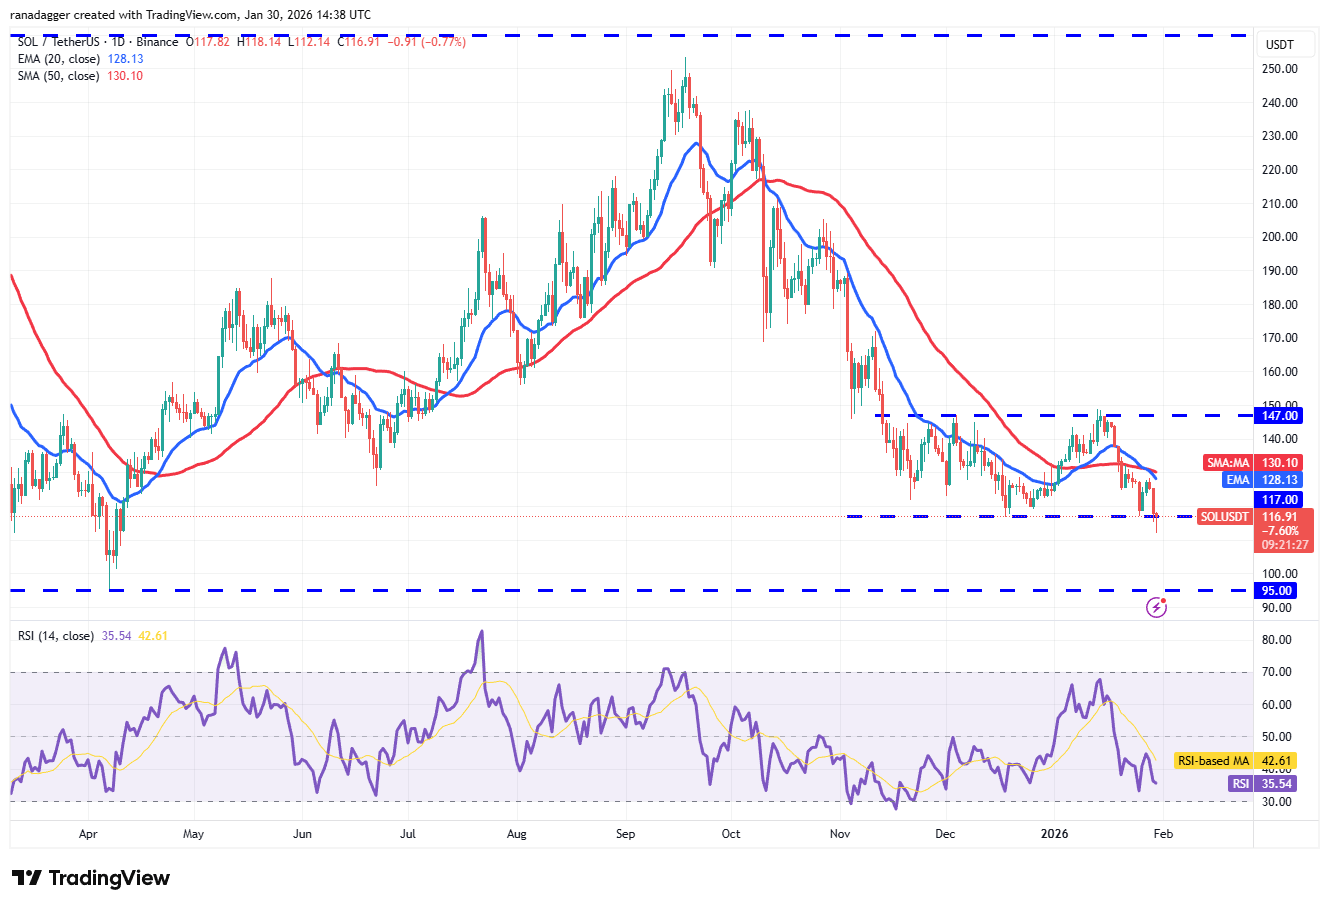
Solana (CRYPTO: SOL) found itself in a similar tug-of-war, with price action oscillating within a range that traders interpreted as a precursor to a directional move. A close below $117 would expose a drop toward the $95 support area, where buyers are expected to mount a stand. The upside, should it occur, hinges on recovering the moving averages and breaking back into the $147 resistance zone, a level that could re-energize the bulls if test-worthy demand returns.
 SOL/USDT daily chart. Source: Cointelegraph/TradingView
Dogecoin (CRYPTO: DOGE) has been stuck in a technically fragile zone, having closed below a critical support near $0.12. The immediate risk is a renewed slide toward the October 2025 low around $0.10 if sellers maintain control. Yet, a bounce above the moving averages could invalidate the bearish setup and pave the way for a rally toward $0.16, where sellers again stand ready to apply pressure.
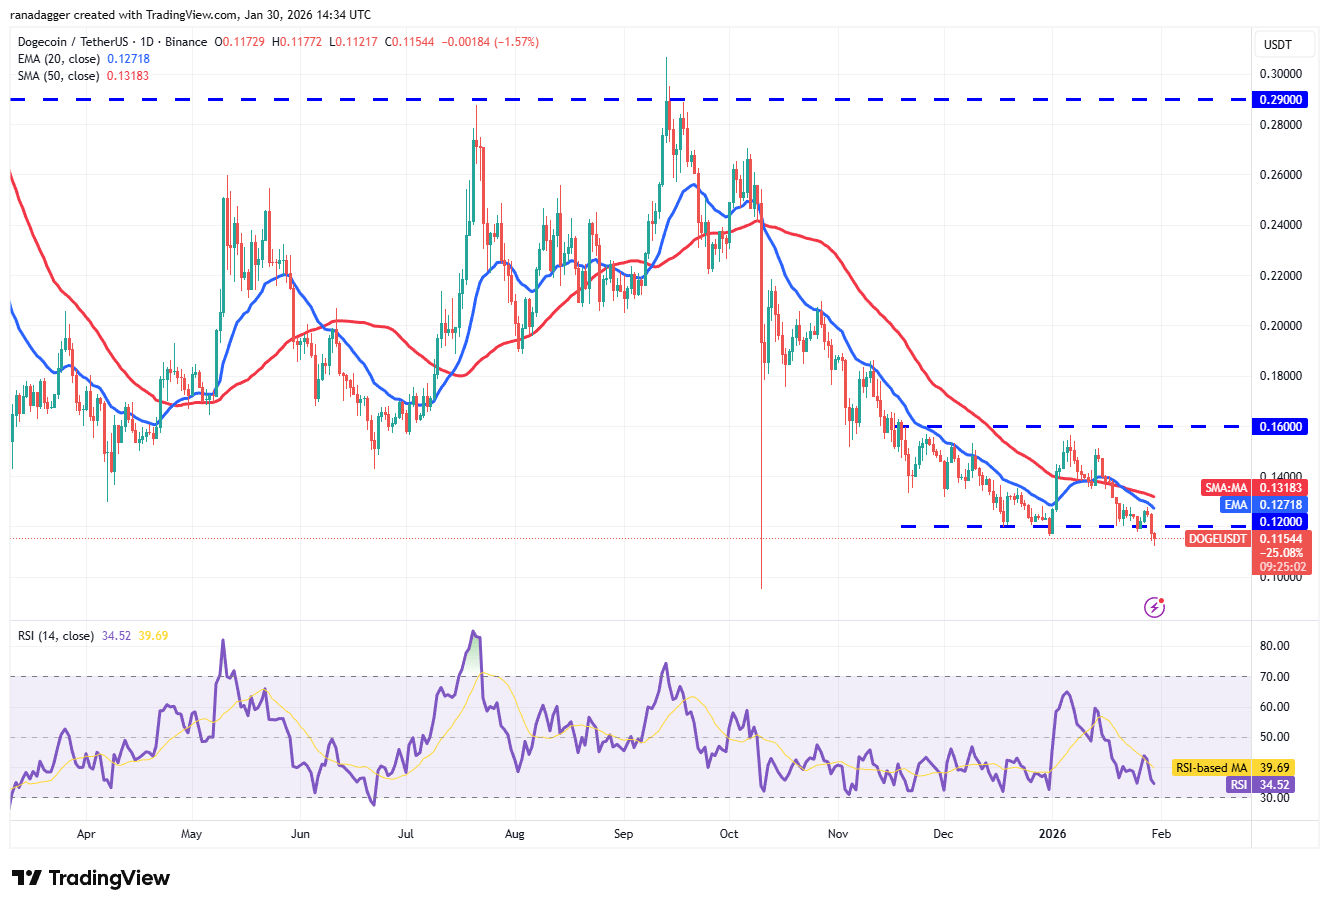 DOGE/USDT daily chart. Source: Cointelegraph/TradingView
Cardano (CRYPTO: ADA) has become a battleground at around $0.33, with buyers and sellers clashing to determine whether it can sustain a push above the downtrend line or fail and target the lower end of its descending channel. A close below the $0.33 support would bring ADA toward the channel’s lower boundary, near the $0.27 area observed in October 2025. If bulls manage to reclaim the line and conquer the downtrend, a rally toward the $0.50 breakdown level could unfold, offering a potential relief rally for patient holders.
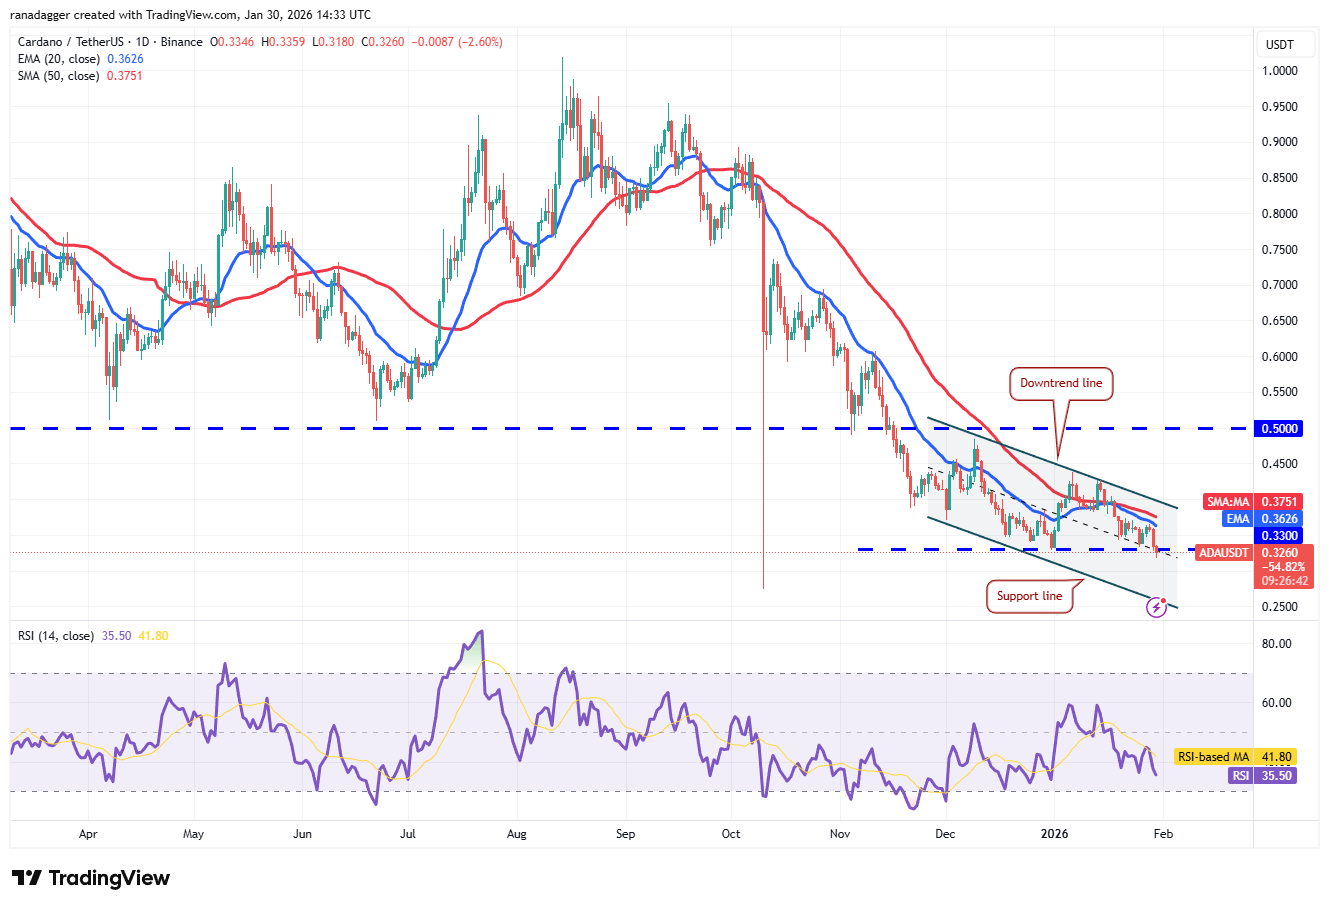 ADA/USDT daily chart. Source: Cointelegraph/TradingView
Bitcoin Cash (CRYPTO: BCH) joined the list of assets flirting with bearish patterns after breaking below the $563 support, hinting at a possible head-and-shoulders formation. Bulls may attempt to defend the level, but a continued break below could push BCH toward $518 and, if downside momentum persists, toward the pattern target near $456. A break above $604 would reframe the outlook, potentially sending BCH toward $631 and even $670 if demand returns.
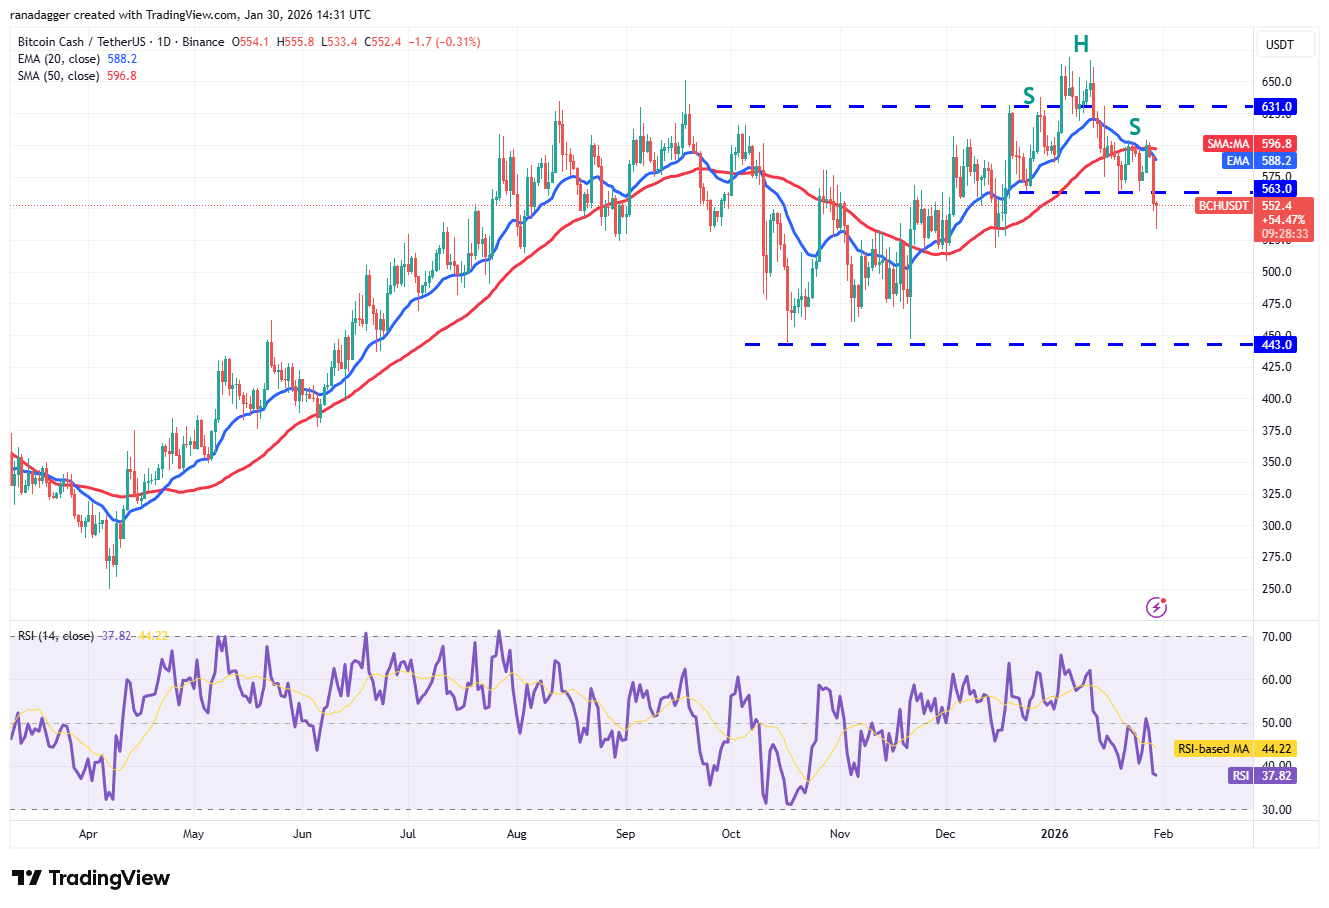 BCH/USDT daily chart. Source: Cointelegraph/TradingView
Hyperliquid (CRYPTO: HYPE) traded near a key resistance at $35.50 after turning away from a breakdown level, suggesting the bears are defending the level with conviction. The 20-day EMA around $26.36 forms a crucial baseline; a bounce from this line could revive the push above $35.50 and set a path toward the $44 area. Conversely, a break below the moving averages could shepherd the price into a prolonged consolidation between roughly $35.50 and $20.82, setting the stage for a potential downtrend continuation if the pattern persists.
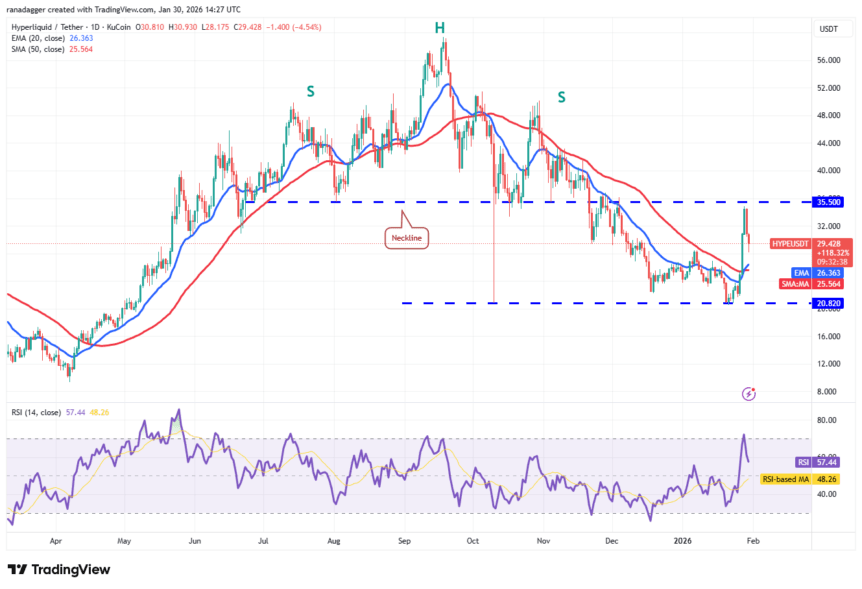 HYPE/USDT daily chart. Source: Cointelegraph/TradingView
Monero (CRYPTO: XMR) has faced ongoing selling pressure as buyers struggle to push through the 50-day simple moving average near $482. The market continues to test the $417 support, and a break lower could unveil a path toward $360. Conversely, a sustained push above the 20-day EMA around $501 would renew the case for a broader recovery, potentially targeting the $546 level where sellers may reemerge. As with many assets in the current environment, the short-term trajectory hinges on the ability to withstand immediate resistance and reassert momentum above pivotal moving averages.
Sources & verification
- Bitcoin price overview and pressure metrics: official price page and market data references.
- Liquidations data cited for BTC over the last 24 hours: liquidation figures referenced in the article.
- Analysis discussing the potential BTC bottom timing and historical patterns related to gold: cited in the article.
- Ethereum price index and related chart analysis showing key support and moving-average dynamics: ETH price index.
- Additional price indices for major altcoins (XRP, SOL, DOGE, ADA, BCH, HYPE, XMR) referenced in the narrative and charts.
Why it matters
The current price action underscores the fragility of the near-term risk landscape in crypto markets. A break below critical supports not only reshapes expectations for BTC but also cascades through the top-cap altcoins, influencing liquidity dynamics and trader positioning across the space. The magnitude of liquidations signals heightened leverage risk and a market more reactive to macro cues than at many points in the recent past. For investors, the emphasis shifts to monitoring levels that have historically defined local bottoms and top-side recoveries, while staying mindful of how external catalysts—like tariff rhetoric or policy shifts—can catalyze swift changes in risk sentiment.
From a risk management perspective, the emphasis remains on defined levels rather than broad speculation. Traders are watching how prices behave around the 20-day moving averages and the major psychological marks (for BTC around $80,600 and $84,000; ETH around a similar tier near $3,000). A sustained hold above critical supports could set the stage for a technical relief rally, while sustained closes below those levels would reinforce a more cautious stance and a potential test of lower targets across the sector. The diversity of outcomes across assets—ranging from Bitcoin Cash to Hyperliquid and Monero—highlights how quickly sentiment can rotate from cautious optimism to renewed caution as price action unfolds.
Community members and developers in the ecosystem will be watching for any shifts in liquidity provision, exchange inflows, and institutional risk appetite. In a market defined by rapid price discovery and episodic liquidity squeezes, even a small change in narrative or a single macro data point can reshape the short-term trajectory of multiple assets. The ongoing tension between bears defending major supports and bulls seeking to reclaim momentum will likely define price action in the near term, with traders sizing bets cautiously as the market digests both technical signals and external headlines.
What to watch next
- Bitcoin must hold above $80,600 to avoid a direct slide toward $74,508; a rebound above the moving averages could retarget the $94,789–$97,924 zone.
- Ether would need to reclaim above $2,787 and then push beyond the 20-day EMA to stabilize the downside; following a breach of $2,623, downside risk intensifies toward $2,111.
- Major altcoins—XRP, SOL, ADA, DOGE, BCH, HYPE, and XMR—will define whether the market broadens its downside or sets up for a relief rally, with key levels including $1.61, $117, $0.33, $0.12, $563, $35.50, and $417, respectively.
- Watch for liquidity dynamics and potential central-bank or regulatory updates that could trigger sudden shifts in risk appetite and flows across DeFi and Layer-1 ecosystems.
Sources & verification
- Bitcoin price overview
- Bitcoin falls to 81k causing billions in liquidations
- Bitcoin loses crucial 84k support—how low can BTC go
- Ether price index
- XRP price index
This article was originally published as Bitcoin’s Last $80k Support in Jeopardy: Will Altcoins Follow? on Crypto Breaking News – your trusted source for crypto news, Bitcoin news, and blockchain updates.
You May Also Like

Zakt de XRP koers verder door de afbouw van leverage in de futuresmarkt?
XRP Just Witnessed a Major Breach on the Daily Timeframe: What Comes Next?