

BTC Slides Below $64K as Extreme Fear and $452M Liquidations Shake Market Hard
Bitcoin falls below $64K as fear index hits 14, with $452M liquidations and $2.13B BTC-ETH options expiring adding pressure.
Bitcoin fell below the $64,000 support level as selling pressure increased across the crypto market. The asset was trading near $62,500 in the provided market update.
The move pushed market sentiment into extreme fear, based on the Crypto Fear and Greed Index. The index dropped to 14 out of 100.
The decline also came during a heavy liquidation period for leveraged traders. More than $452 million was erased from crypto positions within 24 hours.
Bitcoin’s daily chart shows prices near an important technical support area. Traders are now watching whether buyers can defend the $60,400 to $63,000 range.
Market Fear Deepens After Bitcoin Breaks Support
Bitcoin’s drop below $64,000 placed new pressure on short-term market sentiment.
The move followed a failed attempt to hold higher support levels. As a result, traders moved toward a more cautious view.
The Crypto Fear and Greed Index moved into extreme fear at 14. This reading shows weaker confidence across the digital asset market. It also reflects rising concern after Bitcoin’s latest breakdown.
Meanwhile, Bitcoin was trading near $63,054 on the daily chart. Price remains close to the lower end of the marked Fibonacci range. The nearest major support sits around $60,423.
Liquidations and Options Expiry Add Pressure
The market also faced large liquidations during the latest decline. More than $452 million was wiped out across crypto positions.
Long positions accounted for about $361 million of the total. This shows that many traders were positioned for a rebound before the drop.
When Bitcoin moved lower, leveraged long positions were forced to close. That process added more selling pressure to the market.
Options expiry also added pressure to Bitcoin and Ethereum. Around $2.13 billion in BTC and ETH options expired, according to the update.
Both assets closed below their max pain levels, at $65,000 for BTC and $1,725 for ETH.
Read Also:
Technical Chart Shows Critical BTC Levels
Bitcoin’s first major support sits near $60,400 on the daily chart. A break below this level could weaken the current market structure.
Traders are also watching the psychological $60,000 area. On the upside, Bitcoin faces resistance near $68,546.
This level matches the 0.236 Fibonacci retracement shown on the chart. A daily reclaim would suggest buyers are trying to regain control.
Momentum indicators still show a weak market tone. The RSI is near 35.59, while the MACD remains below the zero line.
However, the MACD histogram has turned positive, showing that downside momentum may be slowing.
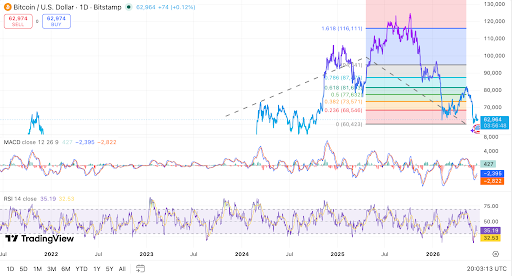 Bitcoin daily chart shows key Fibonacci support test. Source: TradingView.
Regulatory headlines also added to market caution during the session. G7 leaders addressed North Korean crypto theft networks, while United States regulators proposed stablecoin customer ID rules.
At the same time, Kalshi was reported to be in IPO talks at a $22 billion valuation.
The post BTC Slides Below $64K as Extreme Fear and $452M Liquidations Shake Market Hard appeared first on Live Bitcoin News.


You May Also Like

Trump Crypto Manipulation: Explosive Claims of Daily Bitcoin Market Influence Through Geopolitical Statements

Japan Moves Toward New Crypto Laws to Treat Digital Assets Like Stocks

Bitcoin Price Under Pressure: Can the Decline Continue?


