

“Send Them Back to the Stone Age”: How Trump’s Iran Speech Crashed Stocks and Spiked Oil
TLDR
- The Dow fell over 600 points after Trump’s national address offered no clear end to the US-Israel war with Iran
- The S&P 500 dropped 1.2% and the Nasdaq fell 1.7% on Thursday
- WTI crude oil surged 13% to above $113 a barrel, its biggest single-day gain since May 2020
- Bitcoin and other risk assets also declined alongside stocks
- The VIX fear index jumped to 27.66, reflecting rising investor anxiety
President Trump’s primetime address on Wednesday night was expected to reassure markets with a path toward ending the US-Israeli war in Iran. It didn’t.
US stocks fell sharply on Thursday morning after the speech failed to deliver what Wall Street had hoped for. The Dow Jones Industrial Average dropped more than 600 points, or about 1.3%. The S&P 500 fell 1.2% and the Nasdaq Composite sank close to 2%.
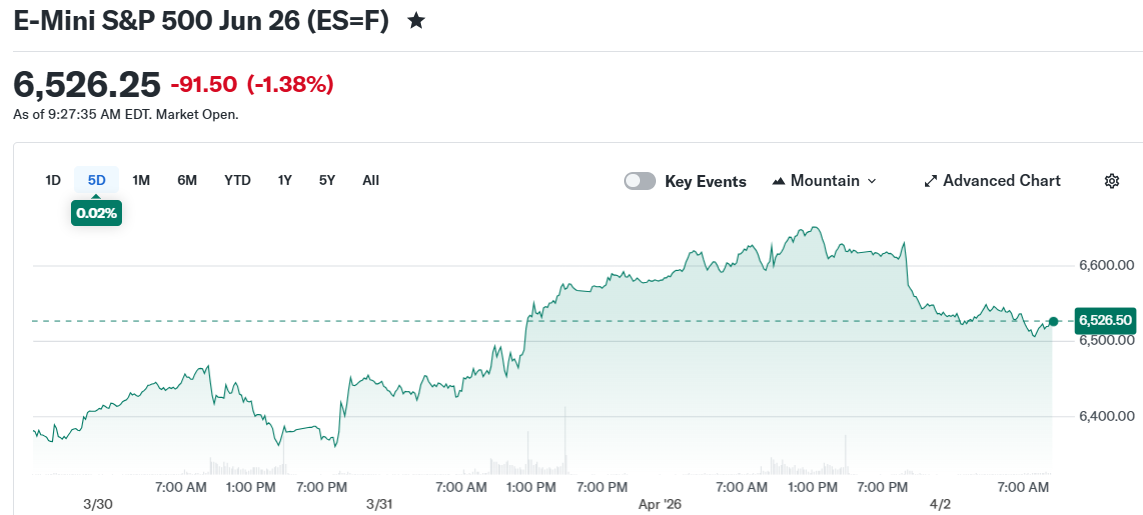 E-Mini S&P 500 Jun 26 (ES=F)
Oil prices moved in the opposite direction. West Texas Intermediate crude jumped 13% to trade above $113 a barrel. That would be its largest single-day percentage gain since May 5, 2020. Brent crude rose 8% to above $109 a barrel.
Brent crude has now risen roughly 50% since the war began in late February. A brief pullback earlier in the week had given investors some hope, but Thursday’s speech reversed that sentiment quickly.
Trump told the nation he planned to “hit Iran hard” and “send them back to the Stone Age.” He also suggested the US would escalate military operations before a withdrawal in two to three weeks. Markets had been pricing in a faster resolution.
The Strait of Hormuz remains a key pressure point. It is a critical shipping lane for global oil supplies, and its status has been closely watched since the war began.
Chip Stocks and Crypto Hit Hard
Chip stocks were among the hardest hit. Nvidia and Broadcom both fell as the broader tech sector sold off. Memory stocks and other growth stocks that had rallied on Tuesday and Wednesday on war-ending hopes gave back those gains.
Bitcoin also fell alongside other risk assets. Crypto markets have been reacting to the same war-driven uncertainty that has weighed on equities for weeks.
The CBOE Volatility Index, known as the VIX, rose 3.12 points to 27.66. That level reflects elevated investor fear and uncertainty in the near term.
David Rosenberg of Rosenberg Research noted that Thursday’s selloff fell on the one-year anniversary of President Trump’s “Liberation Day” tariff announcements, which also rattled markets.
Treasury Yields Rise as Stagflation Fears Return
Treasury yields moved higher. The 2-year note yield rose to 3.83% and the 10-year yield climbed to 4.35%. Rising oil prices have reignited concerns about stagflation, where inflation rises while economic growth slows.
Thursday was the last trading session of a holiday-shortened week. Markets are closed on Good Friday. Investors will be watching the March jobs report, due Friday, for further signals on the health of the US economy.
Weekly jobless claims data released Thursday morning showed an unexpected drop, suggesting the labor market has held up so far despite the ongoing conflict.
The post “Send Them Back to the Stone Age”: How Trump’s Iran Speech Crashed Stocks and Spiked Oil appeared first on CoinCentral.


You May Also Like
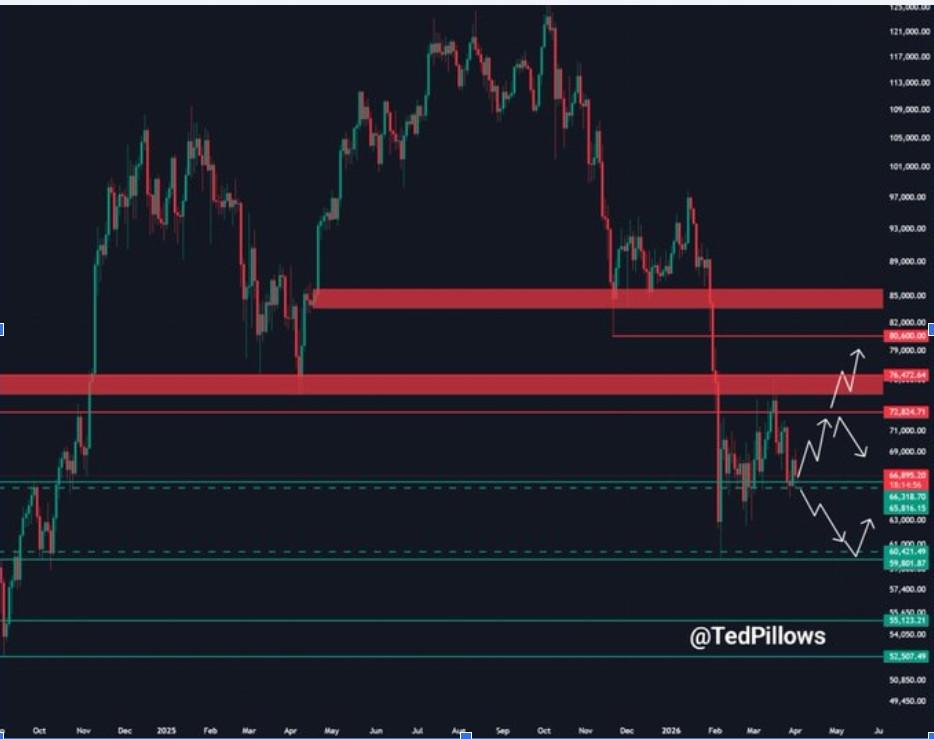
Bitcoin Price Signals Explosive Setup: Can BTC Break Past $70K?

Cardano's Governance Erupts As Justin Bons Targets Hoskinson

Forward Industries’ Solana Treasury Consolidation Plan Hits Wall as Three Firms Say No


