

A New Era of Markerless Insect Tracking Technology Has been Unlocked by Retro-ID
Table of Links
Abstract and 1. Introduction
- Related Works
- Method
- Results and Discussion
- Conclusion and References
2. Related Works
Explicit recognition of retro-id’s value as distinct from reid, and a need to test its performance are, to the best of our knowledge, novel. Re-id however, is well researched for human faces [12, 13, 19, 20, 24], and somewhat so for insects [2–4, 11, 14–16]. Insect re-id algorithms may rely on small markers or tags attached to an insect to track it over separate observations [2, 4, 14, 15]. Six ant colonies were monitored using tags over 41 days, collecting approximately nine million social interactions to understand their behaviour [14]. BEETag, a tracking system using bar codes, was used for automated honeybee tracking [4], and Boenisch et al. [2] developed a QR-code system for honeybee lifetime tracking. Meyers et al. [15] demonstrated automated honeybee re-id by marking their thoraxes with paint, while demonstrating the potential of markerless reid using their unmarked abdomens. Markerless re-id has been little explored. The study of Giant honeybees’ wing patterns using size-independent characteristics and a selforganising map was a pioneering effort in non-invasive reid [11]. Convolutional neural networks have been used for markerless fruit fly re-id [16] and triplet-loss-based similarity learning approaches have also been used to re-id Bumble bees returning to their nests [3].
\ All these studies adopt chronological re-id despite many highly relevant scenarios where this is inefficient. Our study therefore explores retro-id as a novel complementary approach to tracking individual insects for ecological and biological research.
3. Method
3.1. Data Collection
We obtained reed bees from the Dandenong Ranges National Park, Victoria, Australia (lat. -37.90, long. 145.37)[1]. These bees exhibit semi-social behaviour and construct their nests within the pithy stems of fern fronds and other plants [5]. Each nest can consist of several females who share brood-rearing and defence responsibilities. We placed each insect in a separate container to facilitate individual id for testing. In order to run the experiment over several days, insects were refrigerated overnight below 4°C. After warming up, each bee was individually recorded daily in an arena. Here it was illuminated by an overhead ring light and videoed using a Dino-Lite digital microscope for 30–50 seconds per session at 30 fps. We followed the process listed below to create our final datasets.
\
-
Video Processing: Bee videos were processed frame by frame. To automate this, we trained a YOLO-v8 model to detect a bee’s entire body, head, and abdomen in each frame. This enabled automatic establishment of the bee’s orientation in the frame.
\
-
Image Preparation: Upon detection, bees were cropped from the frames using the coordinates provided by Step 1To align bees, we rotated frames using a bee’s orientation before cropping. Centred on the detected entire bee body, a 400x400 pixel region (determined empirically for our bee/microscope setup) was cropped, then resized to 256x256.
\
-
Contrast Adjustment: To enhance image quality and ensure uniform visibility across all samples, Contrast Limited Adaptive Histogram Equalisation (CLAHE) [18] was applied.
\
-
Quality Control: Manual inspection to remove misidentified objects maintained dataset integrity and ensured only bee images were included.
\
-
Dataset Segregation: The final dataset was divided into image subsets, each from a single session, to avoid temporal data leakage.
\ Using Steps 1–5, we curated a dataset of daily bee recording sessions across five consecutive days. Each session included the same 15 individuals videoed for approximately 1200 images/session (total dataset approximately 90K images).
3.2. Network Architecture, Training, Evaluation
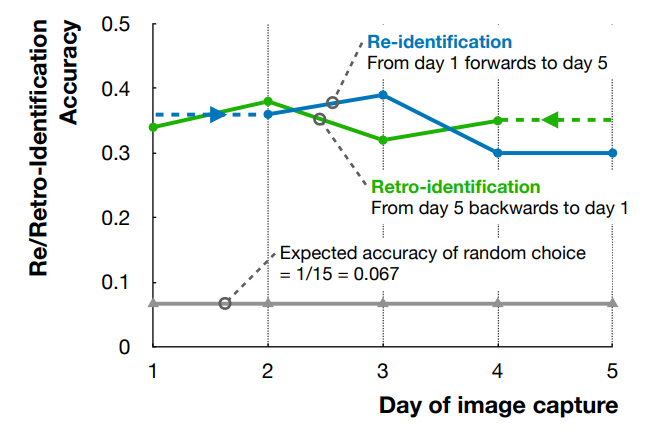
We used a transfer-learning-based approach for re-/retro-id of the reed bees. All models were pre-trained on the ImageNet dataset [6] and subsequently fine-tuned using our own dataset. To identify suitable transfer-learning models, we selected 17 different models distributed across 10 different model architectures and parameter numbers ranging from 49.7 million in swinv2s to 0.73 million parameters in squeezenet1_0. To evaluate the models, we collected a second set of data on Day 5, “set-2”, four hours from the first set using Steps 1–5 (above). We trained all 17 models on the first set of Day 5 data. The 17 models were then evaluated based on their ability to re-id individuals in Day 5 set2 data. From them, we selected the seven models with the highest Accuracy (and F1) scores for further consideration. We then trained this top-7 on our original Day 1 and Day 5 data. We evaluated Day 1 models forward on Day 2–5 data and Day 5 models back in time on Day 4–1 data to conduct our main experiments. These forward and backwards evaluations allowed comparison of markerless re- and retro- id of individual insects. The training process was similar for all of the models we considered. We have used Adam Optimiser with a learning rate of 0.001 with 0.0001 weight decay, with a total 100 epochs on the training dataset. We used cross-entropy loss as the loss function for these models.
\
:::info Authors:
(1) Asaduz Zaman, Dept. of Data Science and Artificial Intelligence, Faculty of Information Technology, Monash University, Australia (asaduzzaman@monash.edu);
(2) Vanessa Kellermann, Dept. of Environment and Genetics, School of Agriculture, Biomedicine, and Environment, La Trobe University, Australia (v.kellermann@latrobe.edu.au);
(3) Alan Dorin, Dept. of Data Science and Artificial Intelligence, Faculty of Information Technology, Monash University, Australia (alan.dorin@monash.edu).
:::
:::info This paper is available on arxiv under CC BY 4.0 DEED license.
:::
\


You May Also Like

U.S.-Iran Crisis Deepens, but Trump Believes Deal Is Possible

How CFTC’s New Framework Will Transform Kalshi and Polymarket Operations

Critical USDT0 Response to Drift Hack Exposes Stark Contrast in Stablecoin Security Protocols


