

XRP Price: Bear Trap or Breakdown? Key Levels Traders Are Watching in June 2026
TLDR
- XRP dropped to around $1.20, losing key support at $1.25 after heavy selling on June 2.
- The $1.25 level has flipped from support to resistance, putting bulls on the back foot.
- Analysts are watching $1.20–$1.21 closely — a breakdown there could push XRP toward $1.13–$1.15.
- Some analysts see the current setup as a potential “bear trap,” pointing to historical patterns from 2020, 2023, and 2024.
- June has historically been a weak month for XRP, with an average return of around -5% since 2014.
XRP fell more than 5% on June 2, dropping from $1.27 to a low of $1.18 before settling near $1.20. The move erased gains made since early February and broke a key support level that traders had been watching.
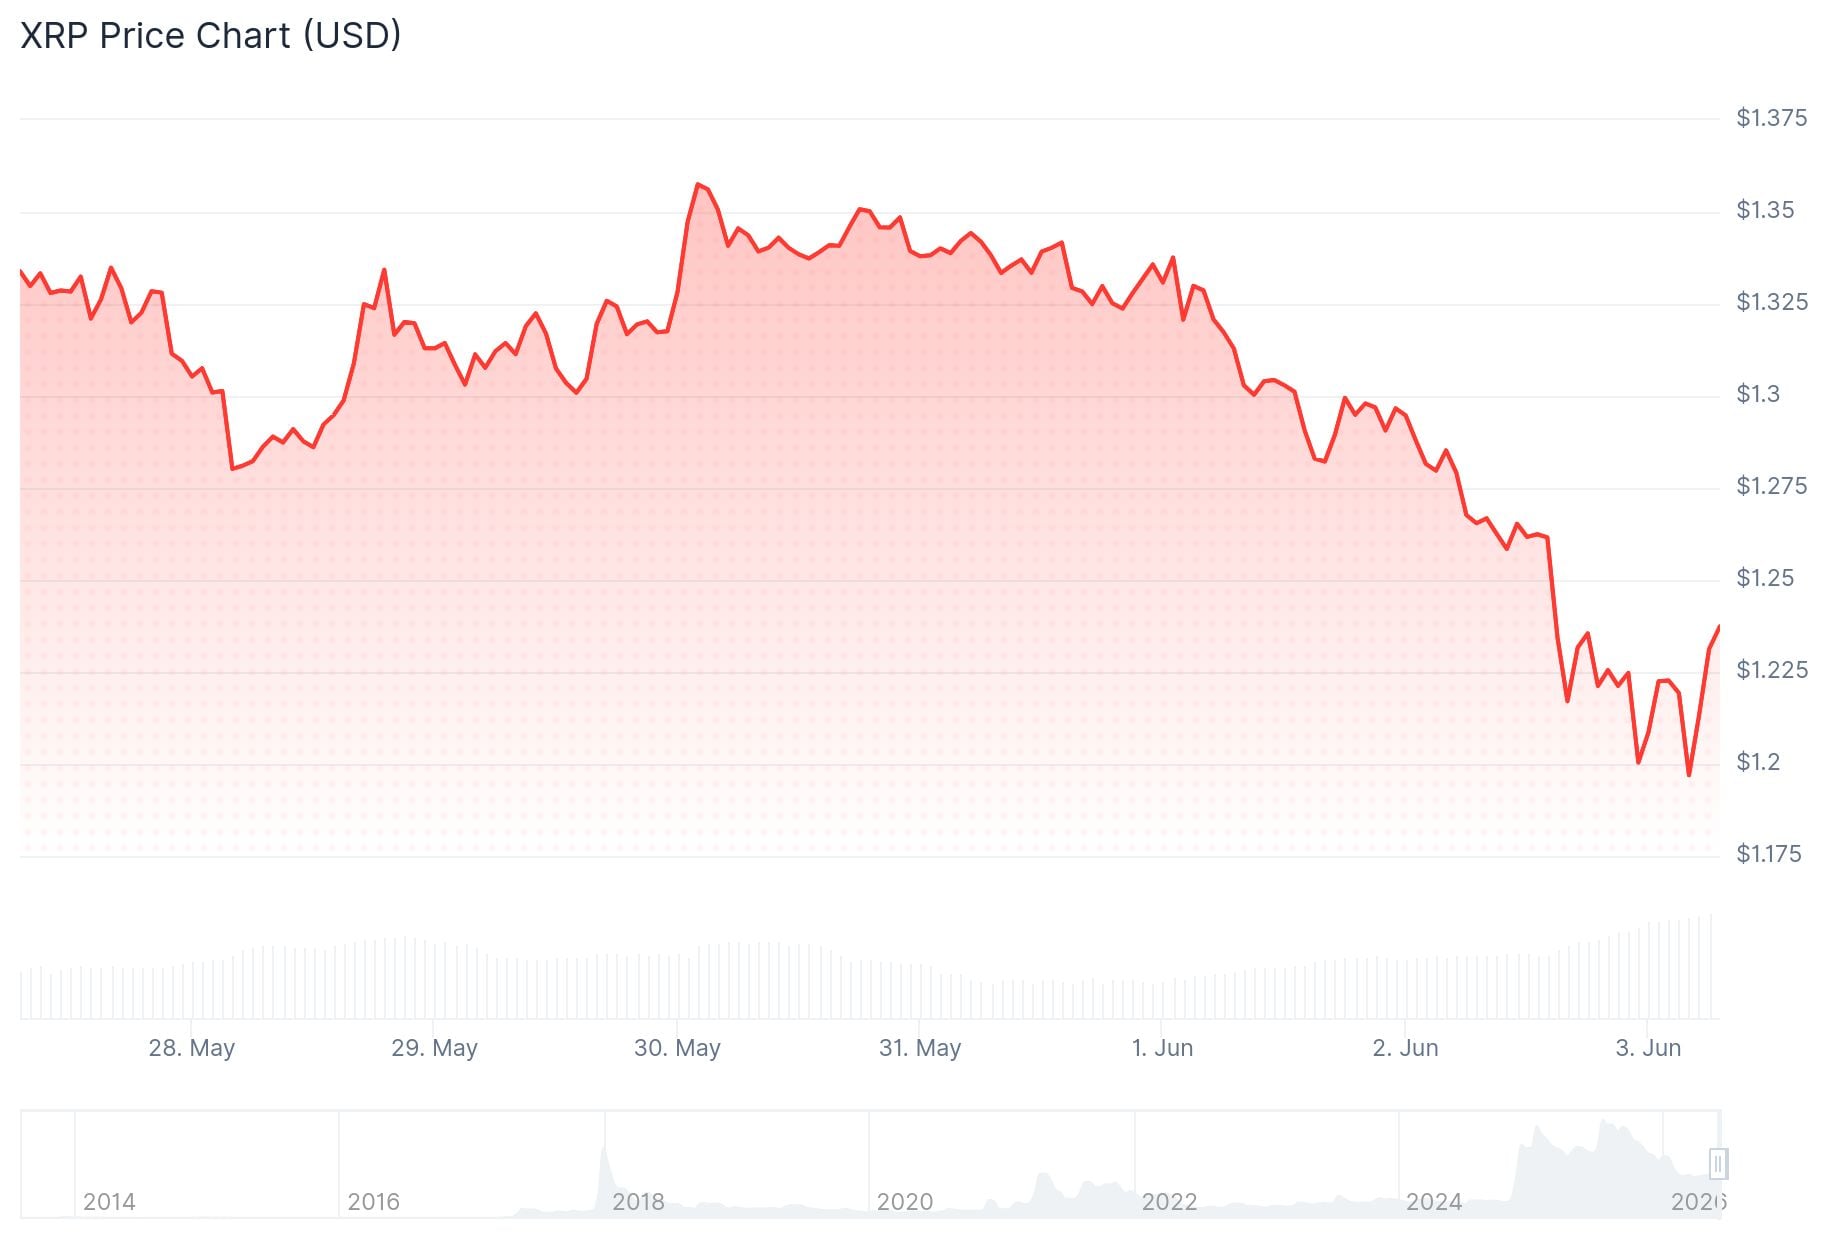 XRP Price
The sell-off came during a market-wide downturn. Volume surged to 205.7 million during the 14:00 UTC session on June 2, which was when price broke through the $1.25 support level.
Since then, $1.25 has flipped from support into resistance. Any recovery attempt will now face selling pressure at that level before bulls can start to feel more comfortable.
Analyst Egrag Crypto noted on X that XRP is currently trading on or slightly below a long-term macro trend line that has held since 2017. He also pointed out that XRP opened June just below the 50-month exponential moving average (EMA) — a pattern that has historically preceded bottoming zones, as seen in 2020, 2023, and 2024.
Analyst Crypto Patel weighed in on X, highlighting what he sees as a second accumulation opportunity after a 66% pullback. He pointed to the $1.10–$1.30 range as a current accumulation zone and said if that support breaks, $0.65–$0.85 could become what he called a “generational entry.” He set long-term price targets at $5, $10, and $15, comparing the current setup to a previous accumulation zone that led to an 835% rally.
Supply Data Not Helping the Price
Despite some positive on-chain signals, XRP’s price continues to slide. More than 25 million XRP left exchanges in recent days, which typically reduces sell pressure. Binance inflows also fell to their lowest levels of 2026. Crypto investment products saw around $1.42 billion flow into spot ETFs during the same period.
None of that stopped the price from falling. When bullish supply data stops lifting price, it often signals that technical selling is in control.
Key Levels to Watch
Traders are now focused on the $1.20–$1.21 zone as the most important support on the chart. A break below that level would open the door to $1.13–$1.15.
Analyst Kamile Uray put the key support range at $1.26–$1.30, warning that losing it could lead to a deeper pullback toward $0.94–$1.11.
Analyst ChartNerd pointed to a potential bottoming zone between $0.70 and $0.90, based on a historical fractal pattern.
June has historically been a difficult month for XRP. Since 2014, the price has closed the month in the red eight out of twelve times, with average returns of around -5%. In years where XRP finished May lower, June losses were worse. The biggest June drops came in 2018 (-23.8%), 2021 (-34.4%), and 2022 (-21.5%).
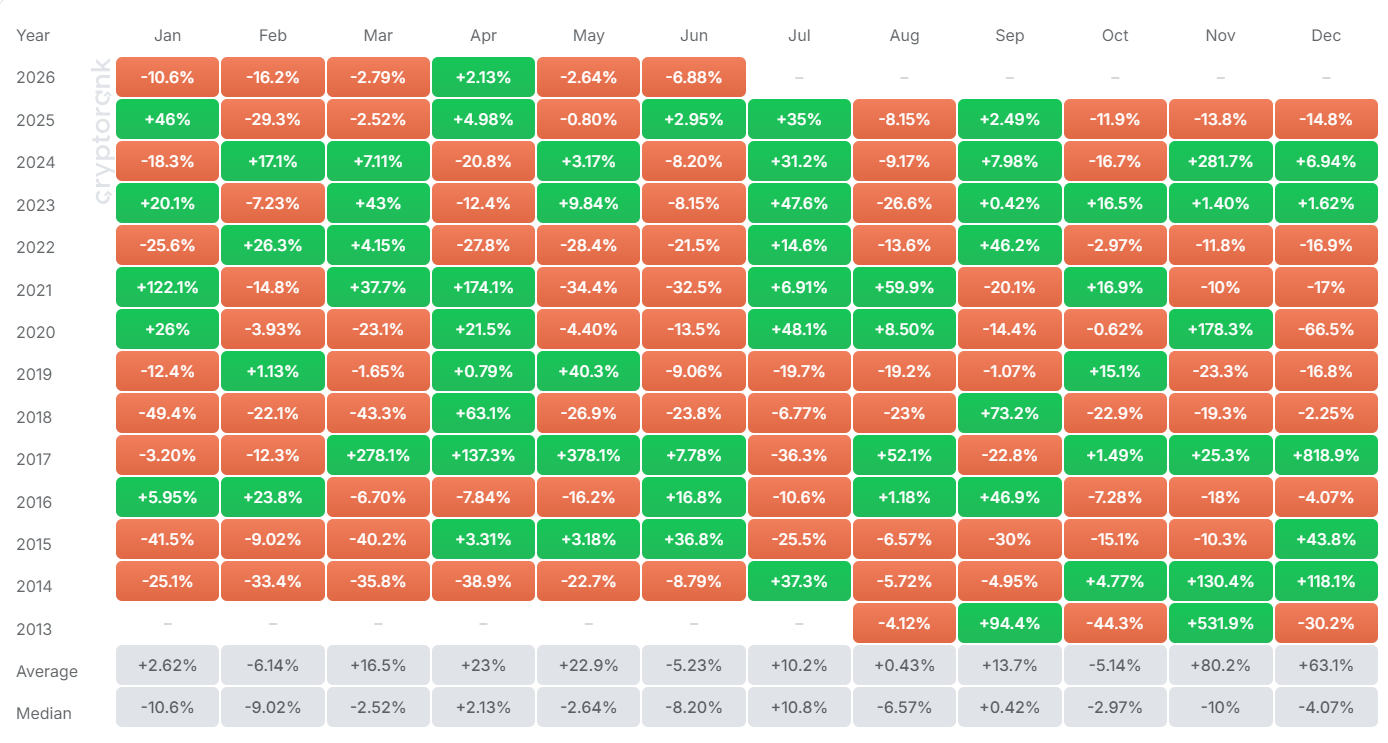 Source: Cryptorank
XRP most recently was trading near the $1.20 area, with traders watching closely to see whether buyers can hold that level into the weekly close.
The post XRP Price: Bear Trap or Breakdown? Key Levels Traders Are Watching in June 2026 appeared first on CoinCentral.


You May Also Like

Ripple CEO Tells Bloomberg: What Are Working Daily to Take Over SWIFT

Bloomberg Odd Lots Host Calls This the Coldest Crypto Winter Ever — And It’s Not Just Bearish Noise

Amazon (AMZN) Stock; Drops After June Prime Day Announcement


