

Zcash (ZEC) Price: Up 50% in a Week — Is the $500 Target Now in Play?
TLDR
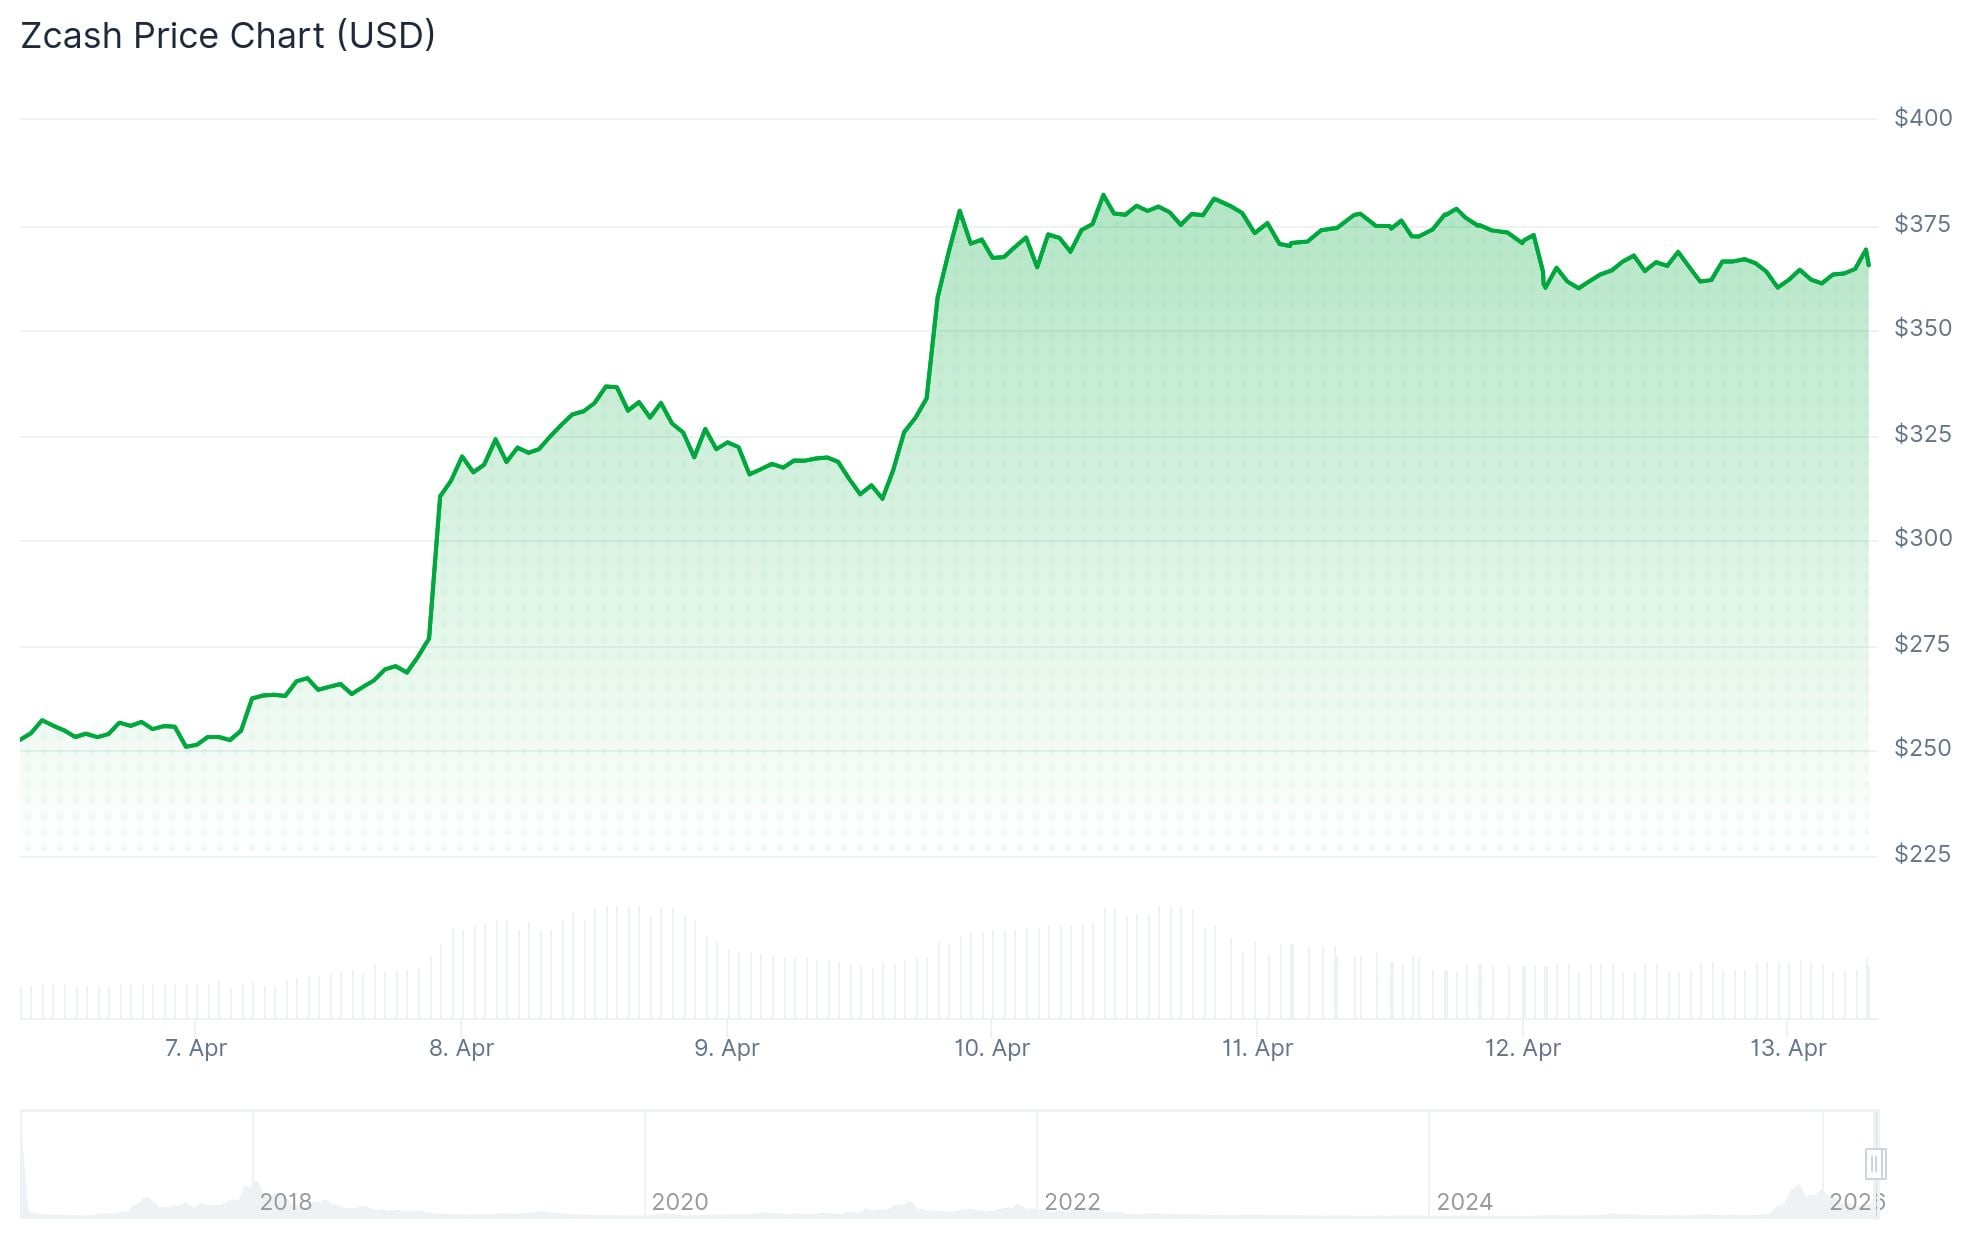
- Zcash (ZEC) is up nearly 50% over the past week, trading around $362 at the time of writing.
- ZEC spiked to nearly $389 on April 10 before pulling back to the mid-$350s range.
- The price has broken above the 20, 50, and 100-day moving averages, now testing the 200-day MA.
- Analyst Rendoshi noted ZEC is showing relative strength while most major crypto assets are declining.
- Key resistance sits at $389, with $500 cited as the next major target by analysts.
Zcash (ZEC) has posted one of its strongest weekly performances in months, rising close to 50% and briefly touching $389 before pulling back. As of press time, ZEC is trading at $362.43, down 3.63% on the day, with a market cap of $6.02 billion and trading volume of $498.36 million.
 Zcash (ZEC) Price
The rally began building in early April, with a sharp intraday move on April 10 when ZEC surged to nearly $389 and closed around $355. Daily gains that session exceeded 16%, accompanied by a rise in trading volume.
Crypto analyst Rendoshi highlighted that ZEC is displaying relative strength during a period when most major assets, including Bitcoin, are pulling back under selling pressure. Rendoshi’s post showed ZEC holding its structure firmly while broader markets weakened, pointing to consistent buying activity at key support levels.
The technical picture shows ZEC has broken above its 20, 50, and 100-day moving averages, rising from a base of around $200. It is now testing the 200-day moving average. The Relative Strength Index (RSI) sits at 72.95, placing it in overbought territory. The MACD is still showing bullish momentum through positive histogram readings.
Charts shared on social media by analyst @Keops01530770 showed ZEC breaking out above $372 on a monthly chart, referencing 50%+ gains driven by strong fundamentals and bullish momentum. Analyst @ramseycrypto also shared a chart showing ZEC breaking out of a long-term descending channel, with the breakout preceding the recent run toward $370.
Technical Patterns Point to Further Upside
Multiple chart patterns have drawn attention from traders. A cup-and-handle formation on weekly charts has been noted, typically associated with sustained accumulation before a continuation move. Separately, a wave 4 triangle pattern identified by analyst vs_sayin on TradingView suggests a breakout above $290 could lead to further upside — a move that has already played out.
 Source: TradingView
ZEC broke out of a descending channel that had formed since late 2025, rising from around $245 at the time of breakout to approximately $370 within days.
Analyst @api_koi posted a Binance chart showing ZEC’s April 10 intraday spike to $389, with a close at $355 amid strong volume and what the analyst described as bullish regulatory and institutional momentum.
Some traders have flagged a possible double-top formation with weak volume, suggesting a brief consolidation phase before a potential push toward $600. Others expect sideways movement lasting one to two weeks before the next directional move.
Regulatory and Institutional Factors Support ZEC
Beyond technical setups, fundamental developments have supported the rally. Regulators recently concluded an investigation involving the Zcash ecosystem, removing a layer of uncertainty that had previously weighed on the asset.
Reports of potential ETF filings tied to privacy-focused digital assets have added to positive sentiment. Zcash’s shielded transaction pool, which enables private transfers using zero-knowledge proof cryptography, has also seen increased activity.
At press time, ZEC was trading at approximately $365.92, down 2.76% in the last 24 hours.
The post Zcash (ZEC) Price: Up 50% in a Week — Is the $500 Target Now in Play? appeared first on CoinCentral.


You May Also Like

Trump's terrifying terrorist list likely has a new name on it — yours

Bitcoin at Crucial Pivot Point, Here's Why Fed Can Tilt Balance


