Introduction
Robinhood Markets, Inc. (NASDAQ: HOOD) just delivered one of the sharpest single-day moves of any large-cap stock this year, surging 13.7% in a single session. For traders and investors trying to make sense of HOOD stock price action after such an explosive move, a structured HOOD technical analysis offers a clearer picture than headlines alone. This article breaks down the HOOD stock chart using data pulled directly from TradingView, covering moving averages, momentum oscillators, pivot levels, and analyst price targets, so you can understand where Robinhood stock stands technically and what key levels to watch next.
This is a technical analysis article, meaning the focus is on price behavior, chart patterns, and indicator readings rather than a deep dive into company fundamentals. Whether you are tracking HOOD stock following its recent breakout, evaluating an existing position, or searching for a HOOD stock price prediction based on chart signals, this breakdown of Robinhood's technical setup is designed to be straightforward and easy to follow.
Data last updated: August 25, 2026, based on the most recent TradingView chart data available at time of writing.
Key Highlights
HOOD closed at $108.13, up $13.03 (+13.7%) in a single session, one of its largest one-day moves this year, though pre-market trading showed a modest pullback to $106.80.
Despite the sharp recent rally, the stock remains down 4.31% over the past year, even as it has gained 5.17% over the past month, highlighting just how volatile HOOD's 12-month journey has been.
TradingView's technical summary rates HOOD a "Strong Buy" overall, an unusually clean signal with zero Sell ratings across all 26 indicators tracked.
Every single moving average from the 10-day through the 200-day registers a Buy signal, with 14 of 15 indicators in Buy territory and only the Ichimoku Base Line reading Neutral.
The Relative Strength Index sits at 62.50, a neutral reading that leaves clear room for further upside even after the stock's outsized single-day gain.
Classic pivot analysis places immediate resistance near $109.85 and support near $96.76, a notably tight range given the size of the recent breakout.
Wall Street analysts maintain a "Buy" consensus on HOOD from 30 analysts, with an average 12-month price target of $124.65, implying further upside of roughly 15% from current levels.
HOOD Stock Price Today: Chart Overview
Robinhood shares closed at $108.13, a gain of 13.7% in a single session, one of the largest one-day moves the stock has posted all year. Pre-market trading showed a modest give-back to $106.80, a normal cooling-off pattern after such an aggressive move. The exact catalyst behind the session's move is best confirmed against same-day news coverage, but the size and shape of the candle, a decisive breakout that landed right at the top of an already-stabilizing technical range, is the kind of price action typically associated with a significant fundamental catalyst rather than routine trading.
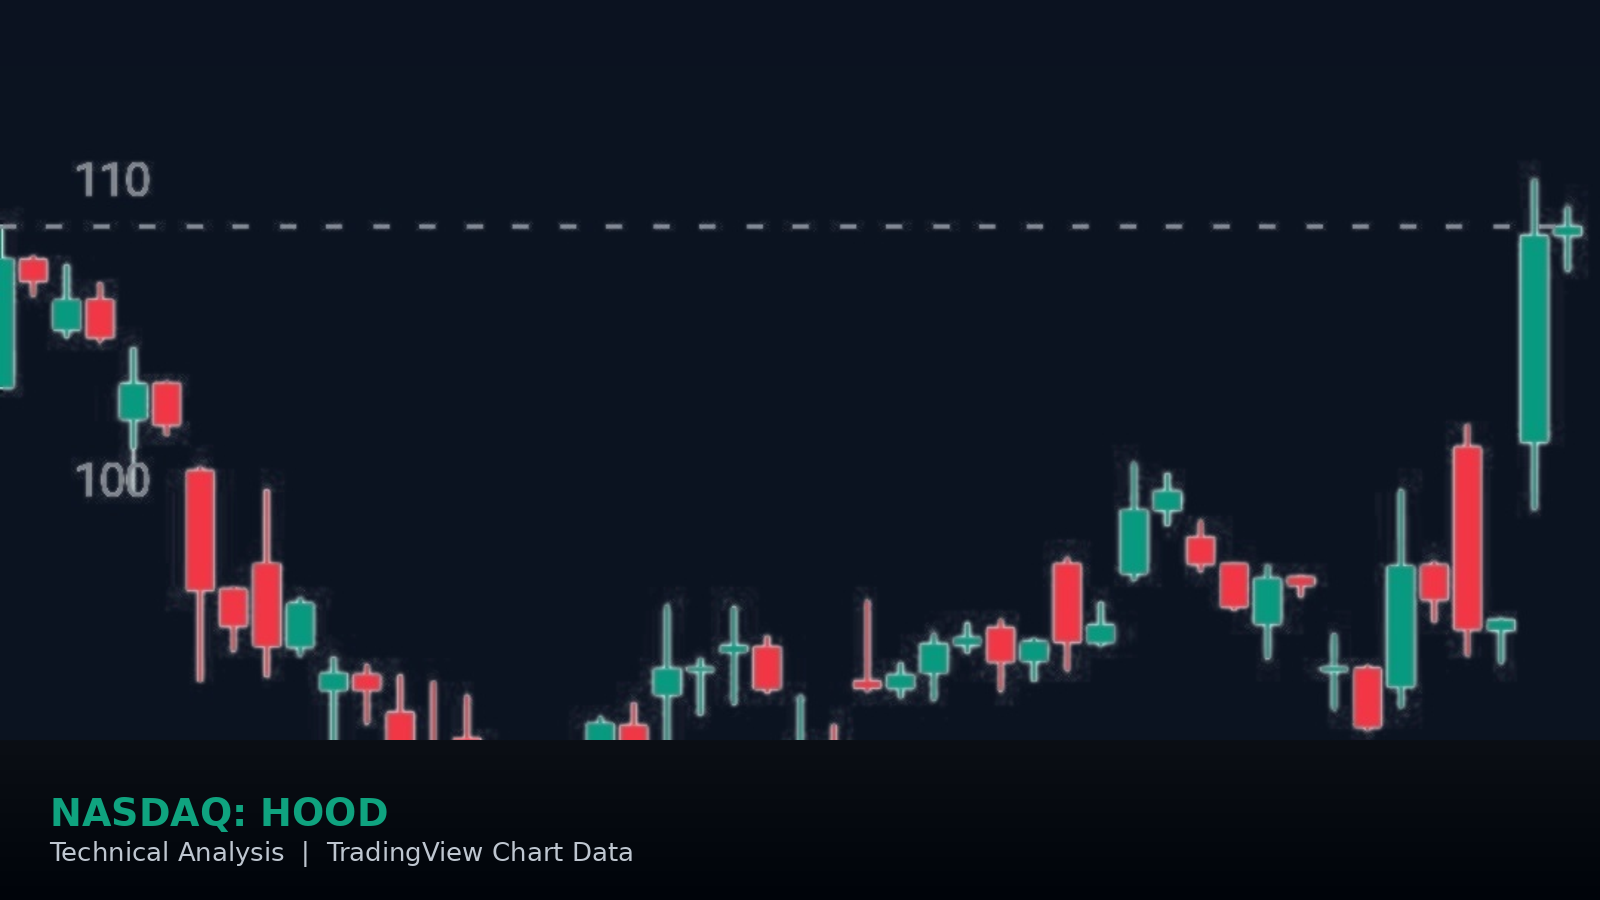
Looking at the one-month candlestick chart, HOOD's story is really a tale of two phases. The stock spent the first three weeks of the period in a steady downtrend, falling from the low $100s to a low near $87 before beginning to stabilize and grind higher through a choppy, sideways consolidation. Then, in the final session shown on the chart, an enormous green candle carried price from around $95 to above $108 in a single day, by far the largest single candle on the entire chart and a clear visual break above the month's prior trading range.
Chart takeaway: this breakout candle dwarfs every other move on the one-month chart in terms of price range, and it occurred right at the upper boundary of the stock's prior consolidation zone, a textbook example of buyers decisively resolving a technical standoff in their favor. Chart data alone doesn't confirm trading volume for the session, so pair this with a volume chart if that detail matters to your analysis.
HOOD 1-Month Candlestick Chart, Source: TradingView
HOOD Moving Average Analysis: Is the Trend Bullish?
Moving averages smooth out daily price noise and help identify the underlying trend. For HOOD, the picture is about as clean as it gets: TradingView's Moving Average summary reads "Strong Buy" with 14 Buy signals against just 1 Neutral reading and zero Sell signals anywhere on the board.
The shorter-term averages confirm the immediate strength of the breakout. The 10-day EMA sits at $97.23 and the 10-day SMA at $96.55, both now well below the current price following the recent surge. The 20-day and 30-day averages (EMA at $96.72 and $96.88, SMA at $93.88 and $97.63) tell a similar story, with price trading comfortably above each of them.
What makes this setup particularly notable is that even the longer-term averages have flipped bullish. The 50-day pairing (EMA $96.09, SMA $100.31), the 100-day pairing (EMA $94.14, SMA $89.82), and the 200-day pairing (EMA $93.01, SMA $96.08) are all registering Buy signals. Given that HOOD was down over the past year as recently as this same reading, having every single long-term moving average already in Buy territory is a meaningful signal that the stock's broader trend structure has shifted, not just its short-term momentum.
The only indicator on the entire moving average and oscillator board that isn't a Buy is the Ichimoku Base Line at $96.70, which reads Neutral. Even the fast-reacting 9-day Hull Moving Average, at $98.27, confirms Buy, reinforcing just how broad-based this technical shift has been.
HOOD RSI and MACD: Is HOOD Stock Overbought?
Oscillators help gauge momentum and whether a stock is overextended in either direction. Here, HOOD's readings are almost entirely neutral to bullish, with the overall Oscillators rating at "Buy" (0 Sell, 9 Neutral, 2 Buy), a constructive picture that suggests the recent surge has not pushed the stock into dangerously overbought territory.
The Relative Strength Index (14) reads 62.50, comfortably within the neutral 30–70 range and notably not in overbought territory despite the massive single-day gain. This is a meaningful signal: a 13.7% move that doesn't push the RSI above 70 suggests the rally has real room to continue without being immediately due for a mean-reversion pullback. The MACD Level (12,26) at 0.05 and Momentum (10) at 14.84 both register Buy signals, confirming that the shift in trend is showing up in momentum indicators as well as raw price action.
The remaining oscillators, including Stochastic %K (74.86), Commodity Channel Index (266.58), Average Directional Index (15.73), Awesome Oscillator (-2.58), Stochastic RSI Fast (78.16), Williams Percent Range (-8.05), Bull Bear Power (14.88), and Ultimate Oscillator (52.06), all sit in Neutral territory. The elevated CCI reading of 266.58 is worth noting even though TradingView classifies it as Neutral, since CCI readings this high often reflect the kind of outsized single-session move HOOD just experienced.
Taken together, the oscillator picture supports the idea that HOOD's breakout is backed by genuine momentum without yet being technically overextended, a favorable combination for a stock that has just broken out of a multi-week downtrend.
HOOD Support and Resistance Levels: Key Pivot Points
Classic pivot point analysis, calculated from the prior trading range, offers a useful framework for identifying where HOOD stock could face buying or selling pressure next. Given the size of the recent breakout, several of these levels sit unusually close to the current price.
Resistance levels: The first resistance level (R1) sits at $109.85, just above the current price and the most immediate level to watch. A close above this level would confirm the breakout has follow-through buying behind it. Beyond that, R2 comes in at $133.13 and R3 at $169.50, both representing much larger, longer-term upside targets if the rally extends significantly.
Support levels: The central pivot point (P) is calculated at $96.76, a level that roughly marks the top of the stock's prior consolidation range before this breakout. Below that, S1 sits at $73.48 and S2 at $60.39, both well below current levels and closer to the stock's pre-breakout lows, areas that would only likely come into play in the event of a significant reversal.
For traders watching the chart in real time, the $96.76–$109.85 zone is the most immediate area of interest, since it captures both the top of the prior consolidation range (now potential support) and the next resistance level above current price.
HOOD Stock Price Target: What Analysts Forecast
Beyond the technical picture, Wall Street sentiment toward HOOD is constructive, though notably more divided than the clean technical signals suggest. Based on ratings from 30 analysts issued over the past three months, the consensus rating is "Buy," with 19 rating the stock Strong Buy, 4 Buy, 5 Hold, 0 Sell, and 2 Strong Sell.
The average 12-month price target stands at $124.65, which implies further upside of roughly 15.28% from the current price of $108.13. Estimates from the 24 analysts offering 1-year price forecasts range from a low of $80.00 (-26.01%) to a high of $163.60 (+51.30%), an unusually wide spread that reflects real disagreement about where a fast-growing but historically volatile stock like HOOD is headed. Unlike some setups where the average target sits below the current price, here the market and the average analyst view are pointed in the same direction, even if the specific targets vary widely.
HOOD Trend Structure and What to Watch Next
Putting the pieces together, HOOD's chart currently reflects a stock that has just resolved a multi-week downtrend with one of the largest single-day breakouts of the period. Every moving average has flipped to Buy, the RSI has room to run before hitting overbought territory, and the MACD confirms the shift in momentum. This is about as unambiguous a bullish technical setup as a stock chart can present.
The key question now is whether HOOD can hold above the breakout zone near $97–$100, roughly where the prior consolidation range and several key moving averages converge, or whether the stock gives back a meaningful portion of the recent pop in the sessions ahead. A hold above this zone, combined with a push through the R1 pivot at $109.85, would be a strong signal that the new uptrend has real staying power. A slide back below $97 would suggest the breakout needs more time to be confirmed.
It's also worth noting the broader fundamental backdrop sitting behind this chart, since it adds useful context to the technical picture. Robinhood's fiscal year 2025 total revenue reached $4.50 billion, with operating income of $2.13 billion, and the stock currently trades at a trailing P/E ratio of 42.11, a premium valuation that reflects strong market confidence in future earnings growth. At the same time, operating cash flow was negative $3.37 billion for the year, reflecting the capital-intensive nature of Robinhood's business model. This combination, a rich earnings multiple alongside a large cash outflow, means the stock's valuation is leaning heavily on continued growth rather than current cash generation, a dynamic worth keeping in mind alongside the bullish technical setup. With next earnings expected around November 4, 2026, and a consensus EPS estimate of $0.50 on revenue of $1.35 billion for that quarter, the next reporting period will be an important test of whether this breakout reflects a durable shift in the company's trajectory or proves to be a shorter-lived move. As with any stock that just posted a double-digit single-day move, volatility should be expected, and traders following HOOD technically will want to watch closely how price behaves around the $97–$110 zone in the coming sessions.
Conclusion
Robinhood (HOOD) stock is showing an unusually clean bullish technical setup following a powerful breakout, with every moving average signaling Buy and momentum oscillators confirming the shift without flashing overbought warnings. That said, the stock's volatile history, still down over the past year despite the recent surge, and a wide range of analyst price targets are reminders that this remains a high-beta name where sharp moves in both directions are the norm rather than the exception. HOOD is a stock worth tracking closely around the $97–$110 zone, where the prior consolidation range and near-term resistance are converging. As always, technical analysis should be used alongside sound risk management and a clear understanding of your own investment objectives.
Frequently Asked Questions (FAQ)
Is HOOD stock a buy right now based on technical analysis?
TradingView's technical summary currently rates HOOD a "Strong Buy" overall, with zero Sell signals across all tracked moving averages and oscillators. This is an unusually clean bullish signal, though it follows a very large single-day move, so confirming against current price action and your own risk tolerance is important before making any decision.
Why did HOOD stock jump 13.7% in one day?
The chart shows a decisive breakout candle consistent with a strong fundamental catalyst, and it landed on top of an already-stabilizing technical setup following a multi-week downtrend. Robinhood's fiscal year 2025 results showed total revenue of $4.50 billion and operating income of $2.13 billion. For the specific reason behind this particular session's move, check same-day news coverage, since chart data alone confirms the size of the move but not its exact cause.
Is HOOD stock overbought after its recent rally?
Not according to the RSI, which reads 62.50, comfortably within the neutral 30–70 range and well below the overbought threshold of 70, despite the stock's massive 13.7% single-day gain. This suggests the rally has room to continue without being immediately overextended.
What is the key resistance level for HOOD stock?
The most immediate resistance sits near $109.85, based on the R1 classic pivot level, just above the current price. A close above this level would help confirm that the breakout has follow-through buying support.
What is the average analyst price target for HOOD?
The average 12-month analyst price target is $124.65, implying approximately 15.28% upside from current levels, based on ratings from 30 analysts with an overall Buy consensus.
What is the main support level to watch for HOOD?
The central pivot point at $96.76 represents the primary near-term support level, roughly marking the top of the stock's prior consolidation range before this breakout. A sustained move back below this level would raise questions about the breakout's durability.
Disclaimer
This article is for informational and educational purposes only and does not constitute investment advice, financial advice, trading advice, or a recommendation to buy, sell, or hold any security. The technical analysis presented is based on publicly available chart data and indicators from TradingView at the time of writing and is subject to change without notice. Stock prices are volatile, and past performance is not indicative of future results. Readers should conduct their own research and consult a licensed financial advisor before making any investment decisions.