

Oracle Stock: Wall Street Sees $330 but Sellers Control the Tape

Oracle stock enters earnings week at a critical juncture. The daily trend remains bullish, but hourly momentum has broken down, with the stock closing June 8 near $211.82. Short-term sellers now control the tape despite the intact daily structure. The next move will be catalytic, not technical.
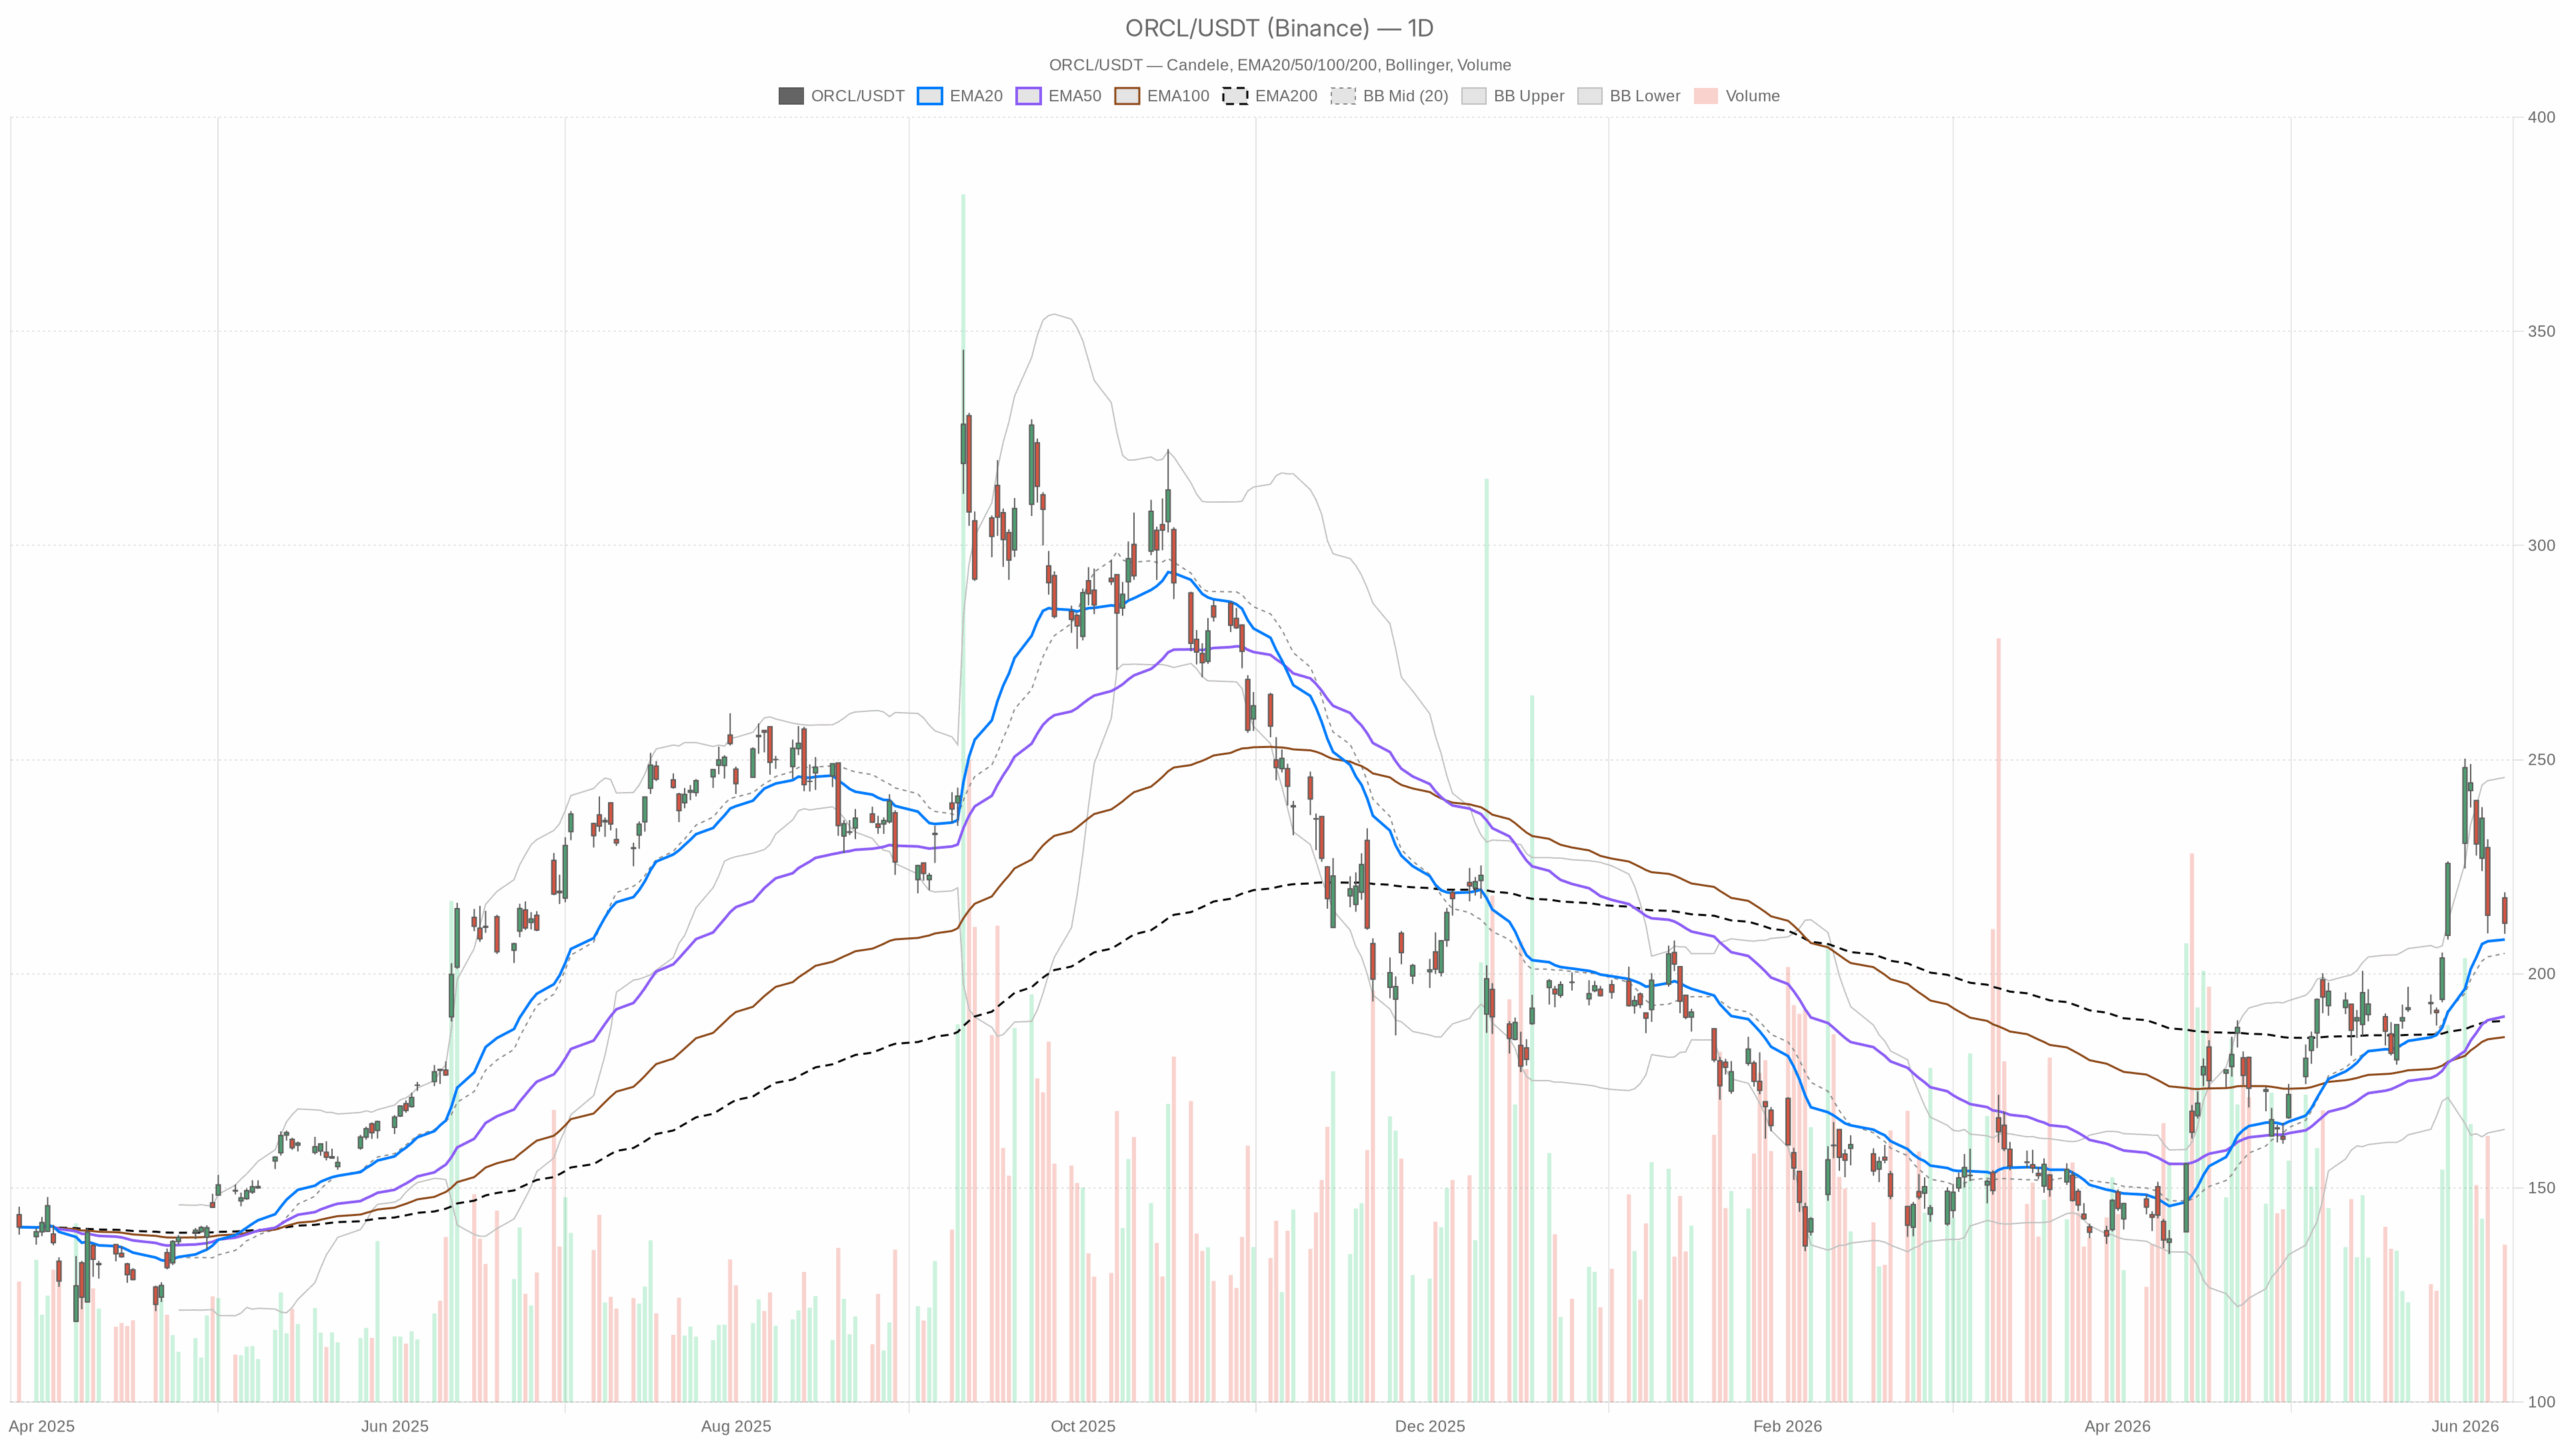 ORCL — daily chart with candlesticks, EMA20/EMA50 and volume.
Daily Chart: Structural Strength Still Intact
Trend Indicators Remain Constructive
On the daily timeframe, Oracle’s regime is classified as bullish, and the indicator stack supports that reading. Price at $211.82 sits comfortably above the EMA20 at $208.01, the EMA50 at $190.07, and the EMA200 at $189.02. That stacking—with price above all three moving averages—signals a mature uptrend that has not been structurally broken.
Meanwhile, the daily RSI at 54.67 is constructive without being overextended. It reflects a market with room to the upside before approaching overbought territory, which typically begins around the 70 level. The MACD remains positive. The line at 12.94 sits above the signal at 12.38, producing a small but positive histogram of 0.56. The daily trend engine is still firing, even if weakly.
Intraday Weakness and Pivot-Level Risks
However, the session on June 8 showed notable intraday weakness. Oracle stock opened at $217.75, reached a high of $219.06, and closed at $211.82. That represents a rejection of over five dollars from the day’s high. This kind of reversal candle, printed near the R1 pivot at $217.48, warrants attention. The pivot point sits at $213.40, with S1 support at $207.75. A sustained break below S1 would begin to challenge the daily bullish narrative.
The Bollinger Bands on the daily are notably wide. The upper band sits at $245.86 and the lower band at $163.68. At $12.92, the ATR underscores that daily volatility is elevated. In practical terms, large swings are the norm here. With earnings approaching, that bandwidth will likely expand further.
Hourly Chart: Momentum Has Broken Down
In contrast to the constructive daily picture, the 1H timeframe is sounding a clear warning. The hourly regime is classified as neutral, but the indicators lean decisively bearish in the near term.
Price at $211.82 now trades below both the hourly EMA20 at $218.61 and the EMA50 at $220.33. This positioning—with price underneath both short and medium moving averages—confirms the recent pullback is not a minor blip. It reflects a genuine shift in intraday supply-demand dynamics.
The hourly RSI at 33.30 is approaching oversold territory. This proximity to the 30-level threshold means Oracle stock could see a short-term technical bounce. However, it also highlights just how aggressively momentum has unwound over the past several sessions. The MACD on the 1H reinforces this reading. The line sits at -4.97, well below the signal at -4.30, with a histogram of -0.67. Downside momentum is still accelerating at the hourly level.
The hourly Bollinger mid-band at $220.60 now acts as overhead resistance. A recovery above that level would be a meaningful development. Until then, the hourly structure points to continued pressure. The pivot point on the 1H is $212.04, with resistance clustered at $212.59 and support at $211.28. This remarkably tight range suggests the market is coiling ahead of the earnings release.
15-Minute Chart: Execution Context and Compression
The 15-minute regime is classified as bearish, and the short-term picture is defined by compression rather than trend. Price trades beneath all three EMAs on this timeframe. The EMA20 sits at $212.82, the EMA50 at $216.09, and the EMA200 at $220.00. This confirms a short-term downtrend structure is intact.
Notably, the 15m MACD histogram has turned fractionally positive at 0.14. The line reads -0.80 and the signal -0.94. That micro-turn could indicate very short-term stabilization, but it carries little weight given the broader hourly context. The 15m RSI at 39.85 is subdued without being deeply oversold. The Bollinger Bands on this frame are extremely narrow. The upper band sits at $214.25 and the lower at $211.48—a spread of under $3. This signals a volatility expansion is likely imminent. That expansion almost certainly comes from the earnings catalyst on Wednesday.
The Bullish Scenario for Oracle Stock: Earnings Catalyst Reignites the Trend
The fundamental backdrop supports a bullish case for Oracle stock. Bank of America recently raised its price target to $240, while Citi pushed its target even higher to $330. Both firms cited strength in the cloud infrastructure business.
Analysts expect fiscal 2026 revenue growth of approximately 17%, driven by cloud demand. Oracle’s backlog has been highlighted as a key measure of AI infrastructure spend. Strong backlog figures on Wednesday could serve as the immediate trigger for a breakout.
If earnings deliver on these elevated expectations, the bullish daily bias would get meaningful confirmation. A reclaim of the $213.40 pivot point and then the $217.48 resistance level would signal that the near-term pullback was simply pre-earnings consolidation. From there, the path toward BofA’s $240 target becomes technically viable. The wide Bollinger upper band at $245.86 suggests structural room for such a move.
The Bearish Scenario: What Would Invalidate the Bull Case
On the other hand, the risks are real and should not be dismissed. Oracle stock already showed a sharp intraday rejection on June 8, closing near the lows after touching $219. That behavior ahead of earnings could reflect institutional distribution—smart money reducing exposure into the event.
If the earnings report disappoints—whether on revenue, cloud backlog, or forward guidance—the already weakened hourly momentum could accelerate. A sharper selloff would follow. Breaking below the daily S1 support at $207.75 would mark a significant technical development. Below that level, the EMA20 at $208.01 may provide limited cushion. A move toward $200 and the hourly EMA200 at $200.29 would become a realistic near-term target.
Therefore, the critical line in the sand on a post-earnings selloff is the $207–$208 zone. A clean breakdown through that area changes the structural picture considerably. Such a scenario would shift the daily bias from bullish to at least neutral, potentially bearish.
Positioning, Volatility, and Uncertainty
Overall, Oracle stock enters earnings week with a daily trend that remains structurally sound but is under visible short-term stress. The timeframe conflict—bullish daily versus deteriorating hourly—reflects pre-earnings uncertainty, not a breakdown of the longer-term thesis.
Still, the ATR of nearly $13 on the daily points to a volatility event ahead. Compressed Bollinger Bands on the 15m chart reinforce this expectation. The resolution will likely be decisive, but its direction depends almost entirely on Wednesday’s earnings.
Until that catalyst arrives, the tape is likely to remain choppy within the $207–$217 range. Traders and investors should size accordingly and be prepared for both outcomes. The setup is live in both directions.


Ayrıca Şunları da Beğenebilirsiniz

200+ Firms Urge Senate to Enact CLARITY Act for Crypto Regulation

Gold continues to hit new highs. How to invest in gold in the crypto market?

Why The Green Bay Packers Must Take The Cleveland Browns Seriously — As Hard As That Might Be


