

Toncoin Price Today Holds Firm at $1.75 Amid Bearish Market Sentiment and Key Technical Resistance

Toncoin shows an unusual pattern — it is neither collapsing nor gaining momentum, holding steady at $1.75 amid a market dominated by fear. This stability is notable given the current crypto environment, with the Fear & Greed index at 10. The toncoin price today reflects this indecision, as it trades near long-term moving averages without clear direction.
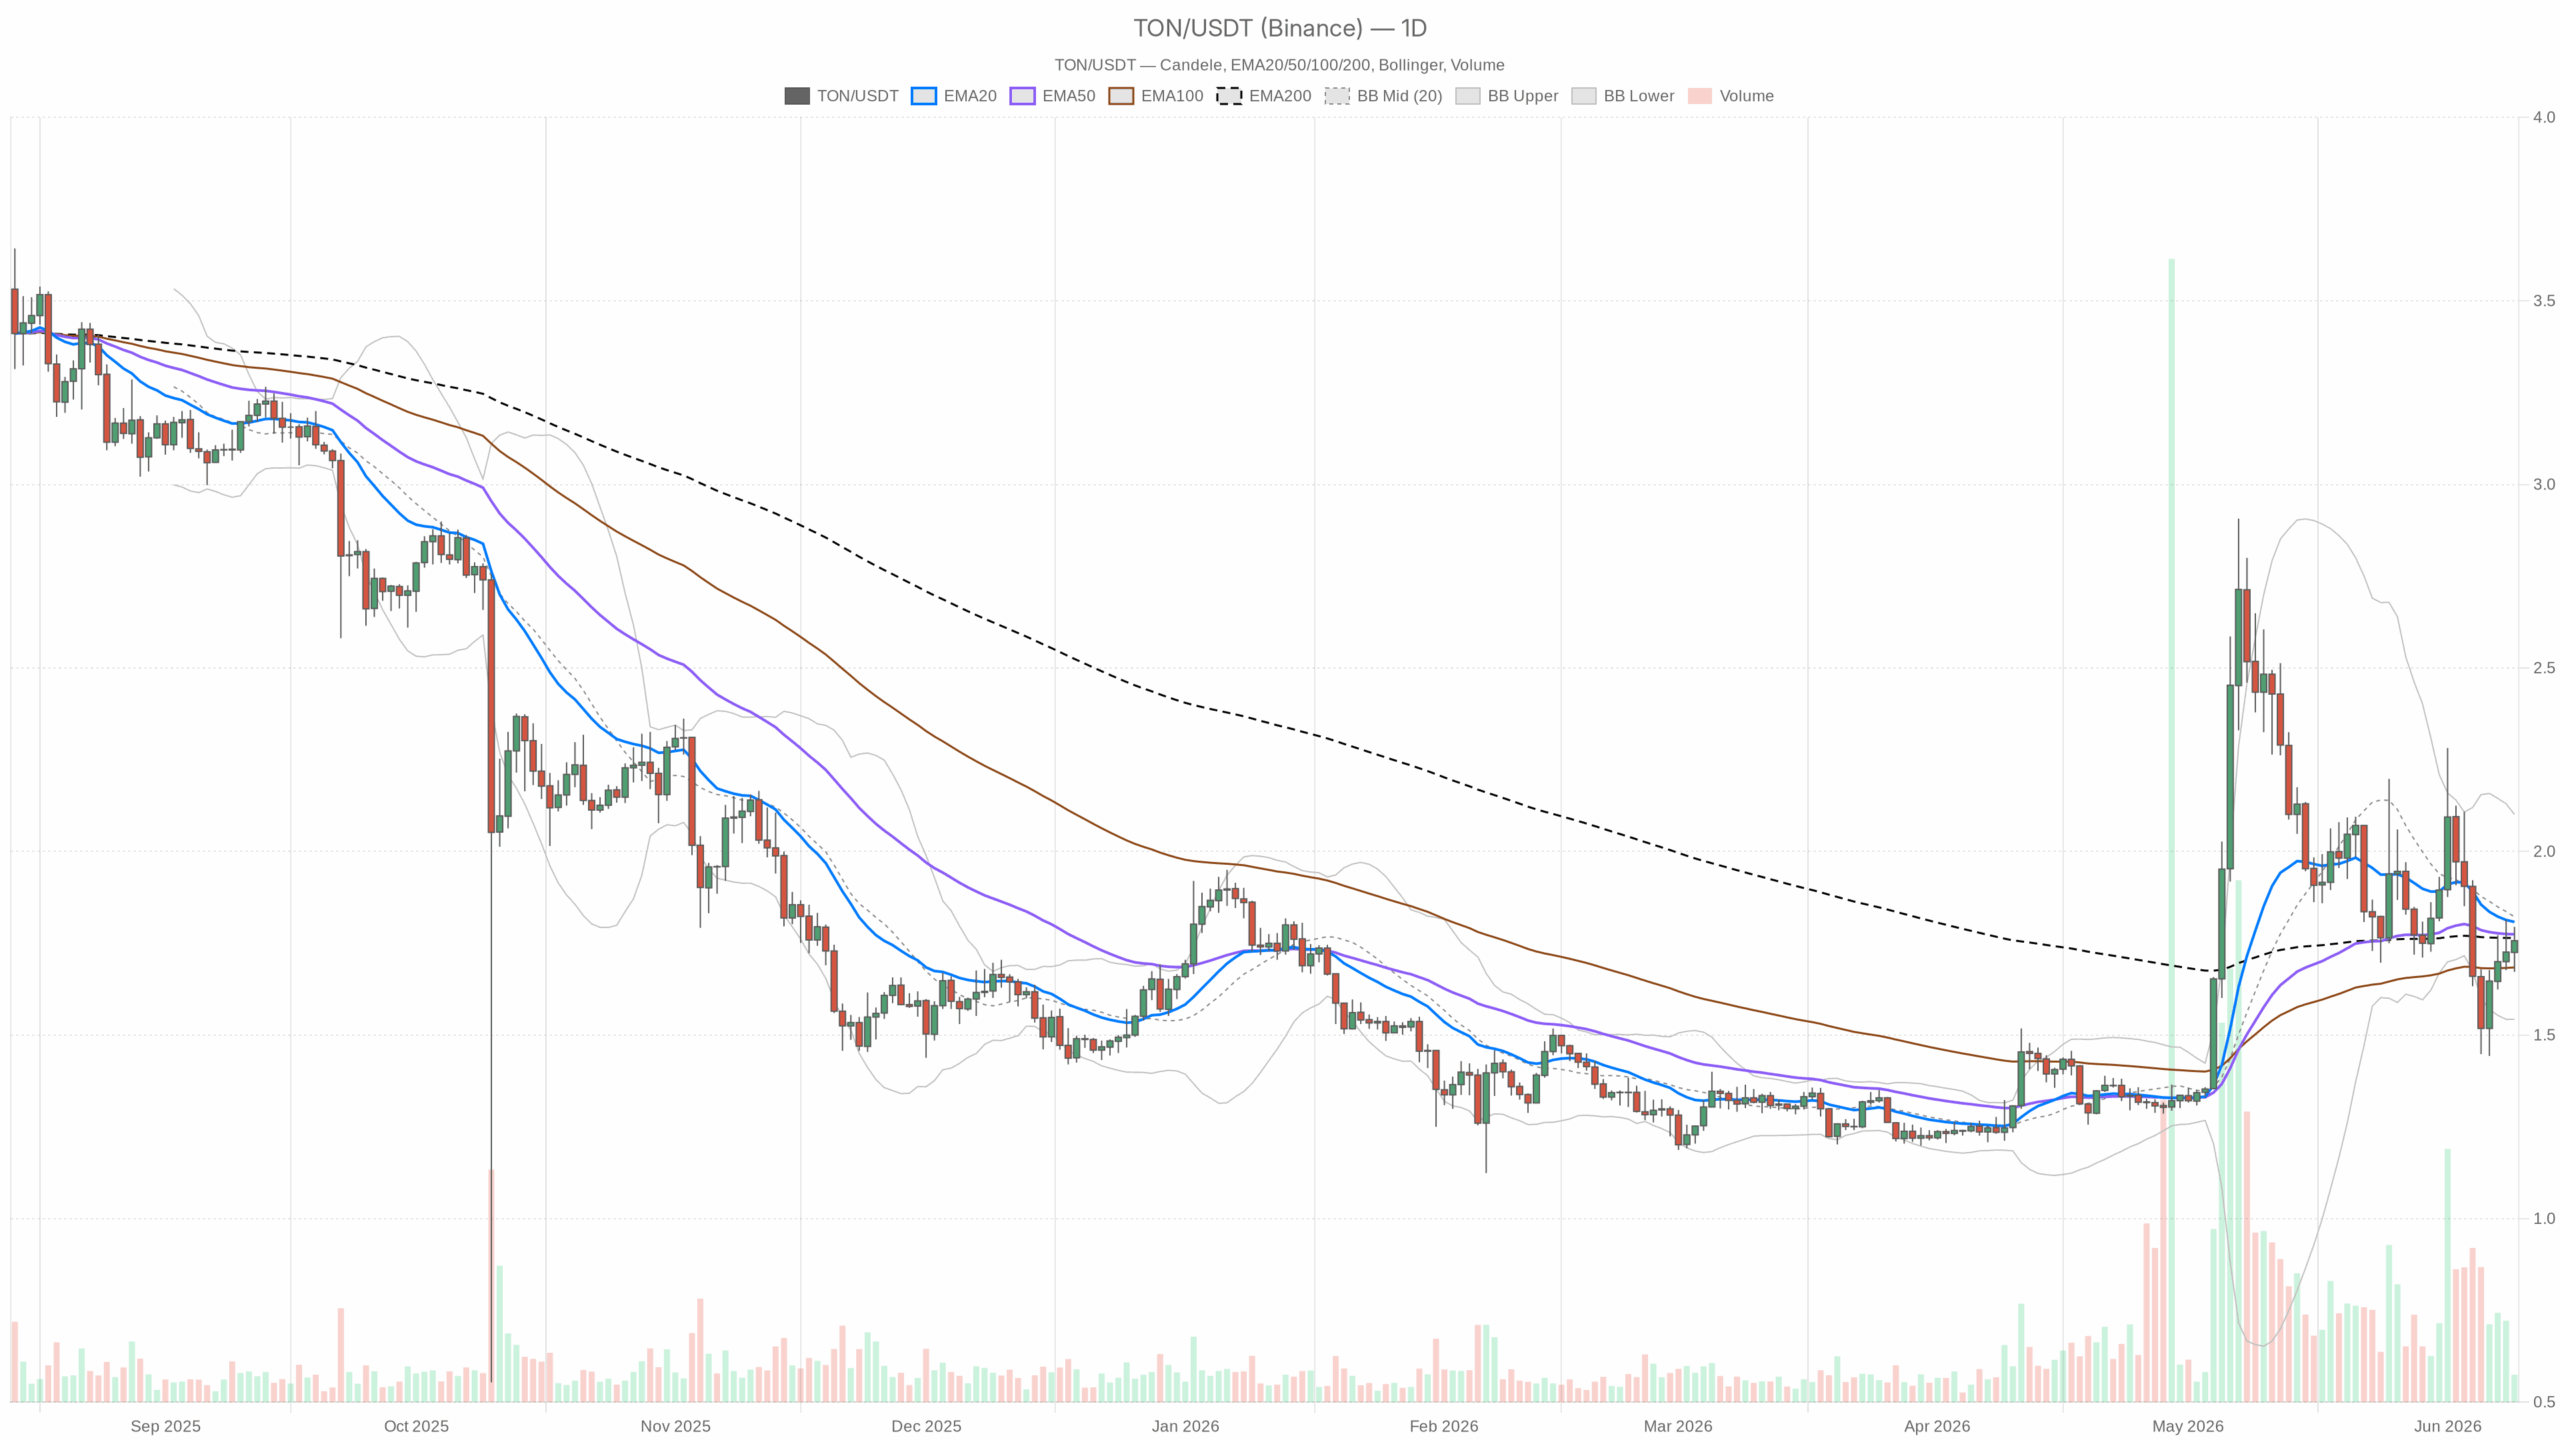 TON/USDT — daily chart with candlesticks, EMA20/EMA50 and volume.
The Daily Chart: Where the Real Weight Is
On the daily chart, the outlook leans bearish despite the “neutral” tag. Toncoin trades at $1.76, below the EMA20 at $1.81, confirming a downward short-term trend. The EMA50 at $1.77 acts more as resistance than support, while the EMA200 at $1.76 provides a fragile floor. The daily RSI at 47.46 indicates a lack of momentum from either bulls or bears.
The MACD remains negative (line at -0.05, signal -0.03), with no sign of reversal. Bollinger Bands are wide, ranging from $1.54 to $2.10, with price below the midline at $1.82, reinforcing bearish pressure. The ATR of $0.19 confirms daily volatility around 11%. Key daily levels include a pivot at $1.74, resistance at $1.81, and support at $1.69.
Hourly Timeframe: A Quiet Recovery That Hasn’t Proven Itself Yet
The 1-hour chart provides a slightly more constructive view. Toncoin trades at $1.75, above EMA20 ($1.74) and EMA50 ($1.72), but meets resistance at the 1H EMA200 ($1.75). The RSI at 54.4 indicates mild bullishness; however, the flat MACD signals indecision. Tight Bollinger Bands between $1.69 and $1.80 hint at an imminent move, but the direction is unclear.
15-Minute Chart: The One Timeframe Showing Bullish Regime
Interestingly, only the 15-minute chart shows a bullish bias. Toncoin holds above rising EMAs (EMA20 at $1.75, EMA50 at $1.74, EMA200 at $1.71), with an RSI of 52.8 and a slightly positive MACD. The low ATR of $0.02 reflects minimal intraday noise, suggesting short-term buyers are accumulating. Nevertheless, this micro-bullish trend contrasts with higher timeframe caution.
Bullish Scenario: What Has to Happen
For the toncoin price today to move upward significantly, it must break above $1.77 (daily EMA50) and then overcome $1.81, where EMA20 and daily resistance converge. A daily close above $1.81 would signal a possible short-term trend reversal. Coupled with improved market conditions and increased on-chain activity, Toncoin could target $2.10, the upper Bollinger Band — a roughly 20% gain. Failure to breach $1.81 would mark this as a weak rally.
Bearish Scenario: The Downside Path Is Clearer
The bearish case remains dominant with the daily MACD in negative territory and RSI below 50. DeFi usage on TON is declining sharply, aligning with risk-off sentiment in broader crypto markets. A daily close below the $1.74 pivot opens the path to $1.69 support, and potentially $1.54 at the lower Bollinger Band — a 12% drop. Continued risk aversion could drive this scenario without new negative catalysts.
Positioning Context and Risk Awareness
Toncoin faces a critical juncture. Calling this phase a strong buying opportunity neglects significant bearish evidence. The $1.75–$1.76 zone near the EMA200 is crucial, with daily closes below $1.74 indicating further downside risk. Conversely, closes above $1.79–$1.81 may challenge bearish momentum. Given the $0.19 daily ATR, managing volatility with careful position sizing and stop placement is essential. Short-term traders may find some intraday setups, but ignoring the daily chart’s bearish tone is risky.
Patience is key in this market environment, not impulsive trading.


Ayrıca Şunları da Beğenebilirsiniz

AstroX Finance Partners with Okratech Token to Unlock DeFi Liquidity on Web3 Entertainment Platform

How to Spot a South African Cyber-Scam Before You Click “Pay”

Tom Lee: Stock Market Bull Run Is Not Over — Recent Dip Is a ‘False Narrative’


Popüler Haberler
Daha fazla
